
Birthday Boosts & Barriers: The Relative Age Effect in the PWHL
How does a player's birthday impact their success on the ice?

The time of year in which you’re born can determine many things, including the types of celebrations you have, which holiday your birthday gets lumped in with (we see you, December babies) – and maybe even your success in sport.
Laying the Groundwork
The widely cited overrepresentation of athletes with birthdays earlier in the calendar year is known as the “relative age effect”, or RAE. A research paper from 1985 analyzed birthdays of hockey players in the NHL, OHL, and WHL.1 It reported a significant downward trend in birth month representation throughout the calendar year. The leading hypothesis on what underpins this phenomenon refers back to age groupings in youth organized sports, which conventionally rely on birth year to define cutoffs. At this stage of rapid development, relatively older players (e.g., born in January or February) have advantages, such as greater strength, coordination, and maturity, over their younger teammates and opponents (e.g., born in November or December). This discrepancy is widened when these older, more advanced players are selected for further development opportunities, such as coaching and ice time.
An analysis of data from the Swedish Ice Hockey Association concluded that the RAE was present in women’s youth hockey in Sweden, but the effect varied by position.2 A study on the Canadian women’s national teams, spanning 1998 to 2009, also reported evidence that the RAE depends on position.3 Additionally, the strength of the RAE across sports might differ by age group (more apparent in youth when developmental disparities are more pronounced) and gender (more apparent in boys/men), as was found in research involving European female soccer players.4
The International Ice Hockey Federation recently posted an Instagram reel that presents data on the distribution of birth months across the 2026 U18 Women’s World Championship tournament, with a seemingly high proportion (41%) of players born in the first quarter of the calendar year. But does this phenomenon carry into the PWHL?
Diving Deep into the PWHL
As is commonly done, we can divide birthdays into quarters of the calendar year to make the analysis more meaningful. Figure 1 shows the distribution of birth quarters in the PWHL pre-expansion (2024-25) and currently (2025-26).
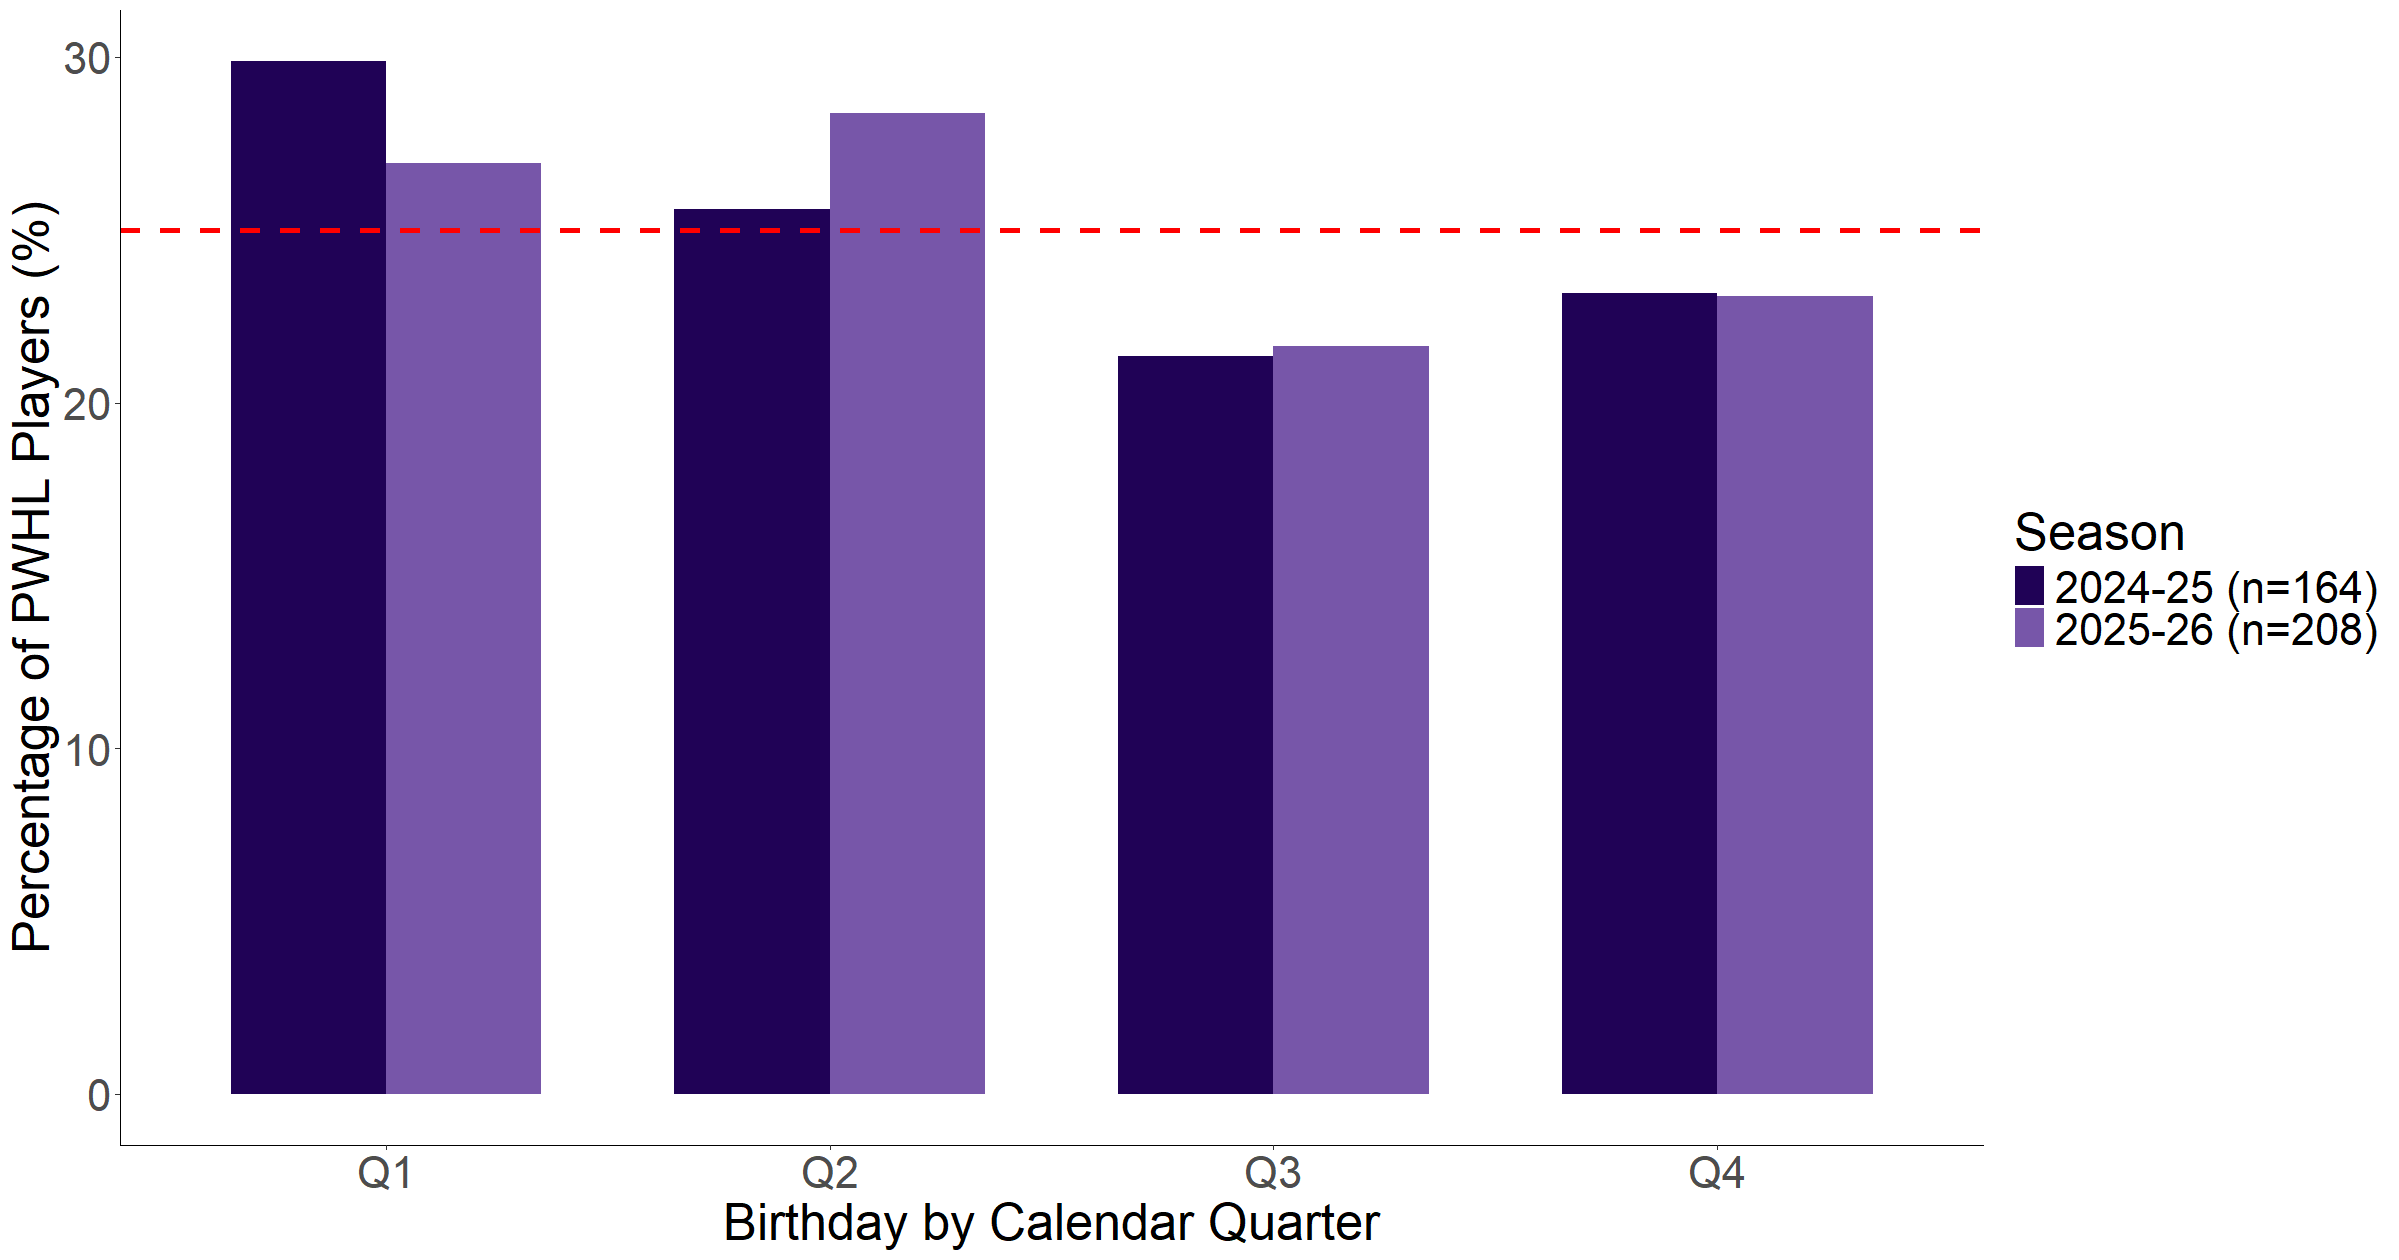
It looks like league trends pre- and post-expansion remain consistent, with the first two quarters composing a bit more than their fair share of birthdays. But there might be more than meets the eye – we can run a statistical test to see if these data deviate significantly from the expected distribution, assuming that it's uniform (i.e., 25% of birthdays in each quarter), or if these differences are likely due to chance. Sure enough, neither the observed 2024-25 nor 2025-26 distributions differ significantly from the expected uniform distribution, indicating a lack of evidence for the RAE.*
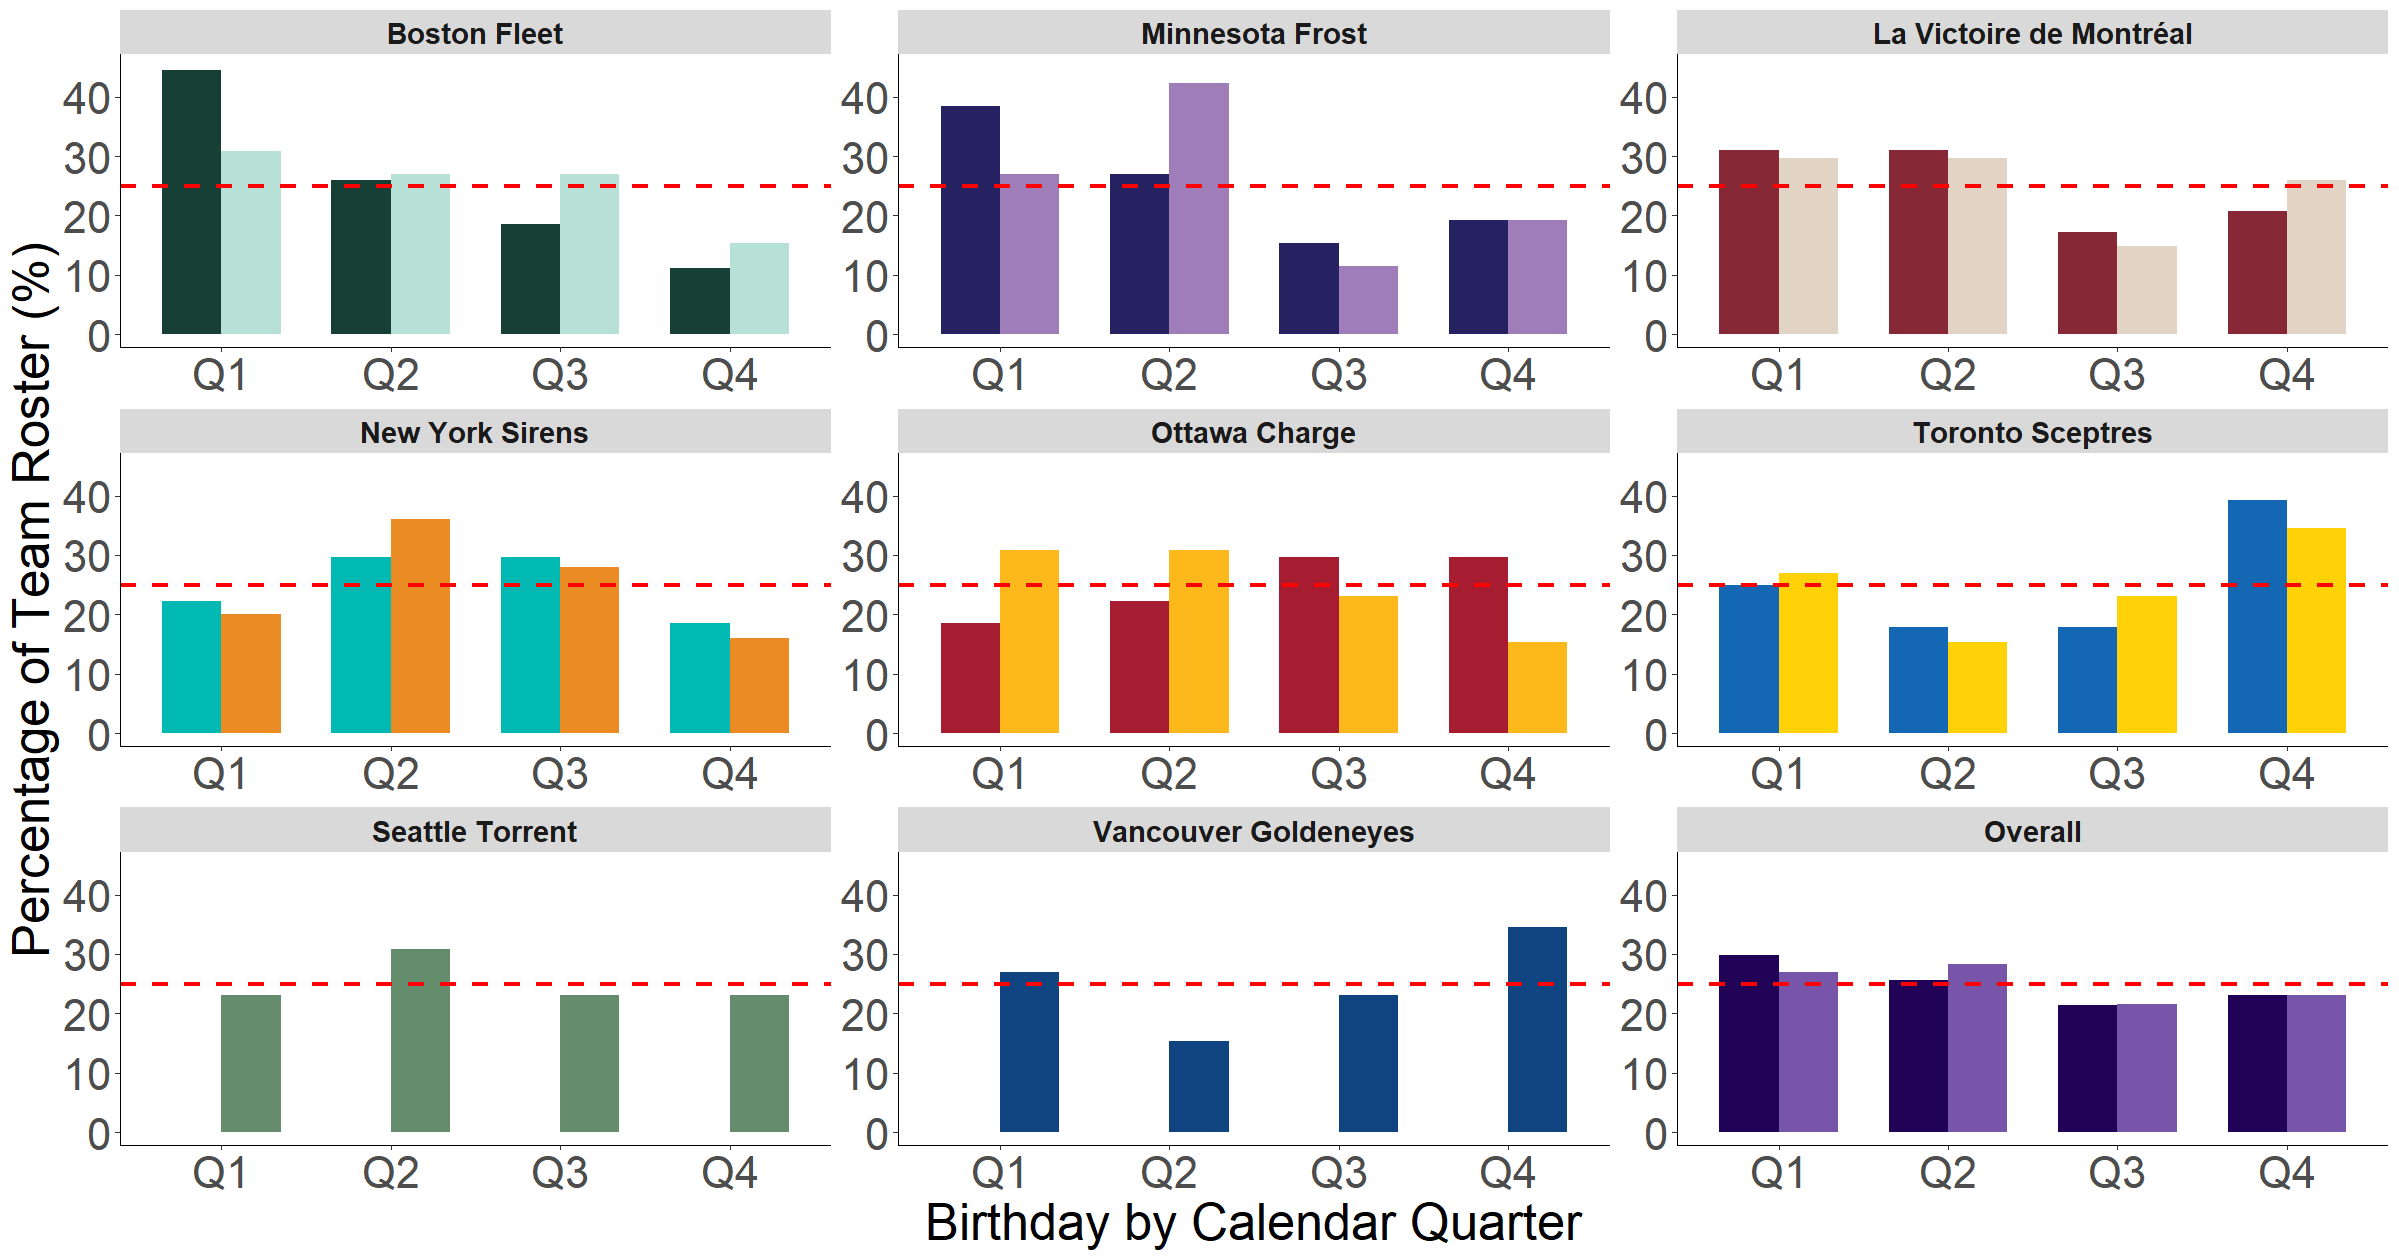
In Figure 2, we break the data down by team, with the caveat that the expansion teams only have 2025-26 rosters and that players are attributed to the receiving team in the case of trades. The Boston Fleet represent the most compelling case of the RAE in action, while the Toronto Sceptres seem to favour later birthdays instead. But all things being considered, fluctuations between birth quarters and variation between teams appears to be quite random.
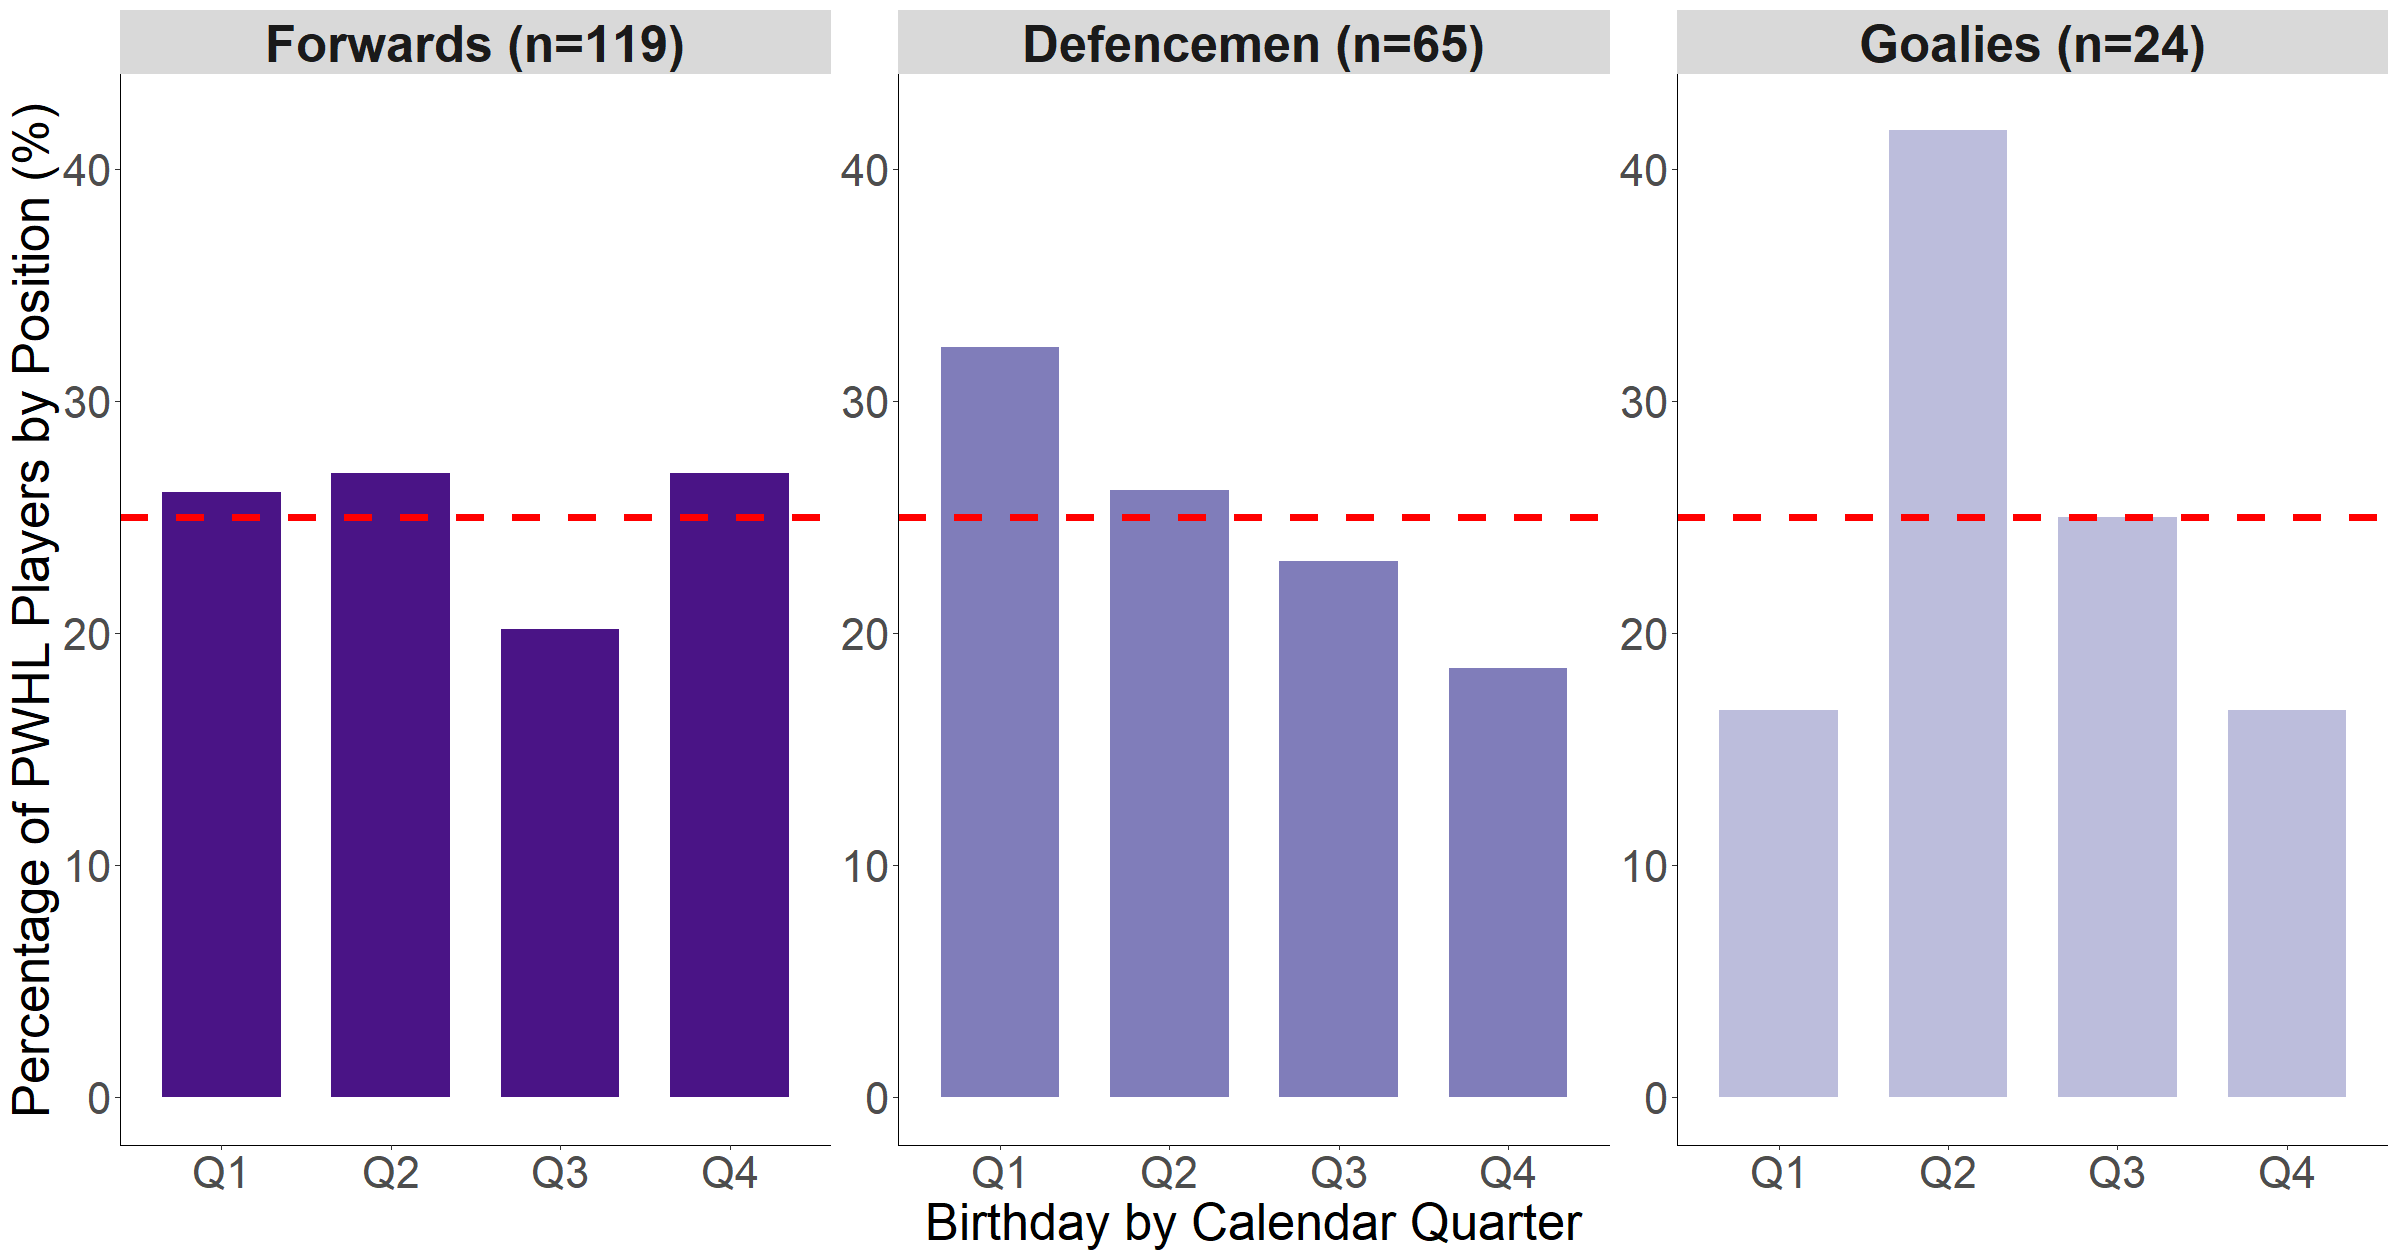
As seen in other analyses, we can also break the data down by position (Figure 3): forwards, defencemen, and goalies. There seems to be a deficit of forwards born in Q3 and a surplus of goalies born in Q2, but the most interesting result is in the middle plot. Among defencemen, the notable decline in birthdays throughout the year presents the strongest evidence of the RAE so far – and results of a statistical test agree that this downward trend is significant.**
Zooming Out On Women’s Professional Sports
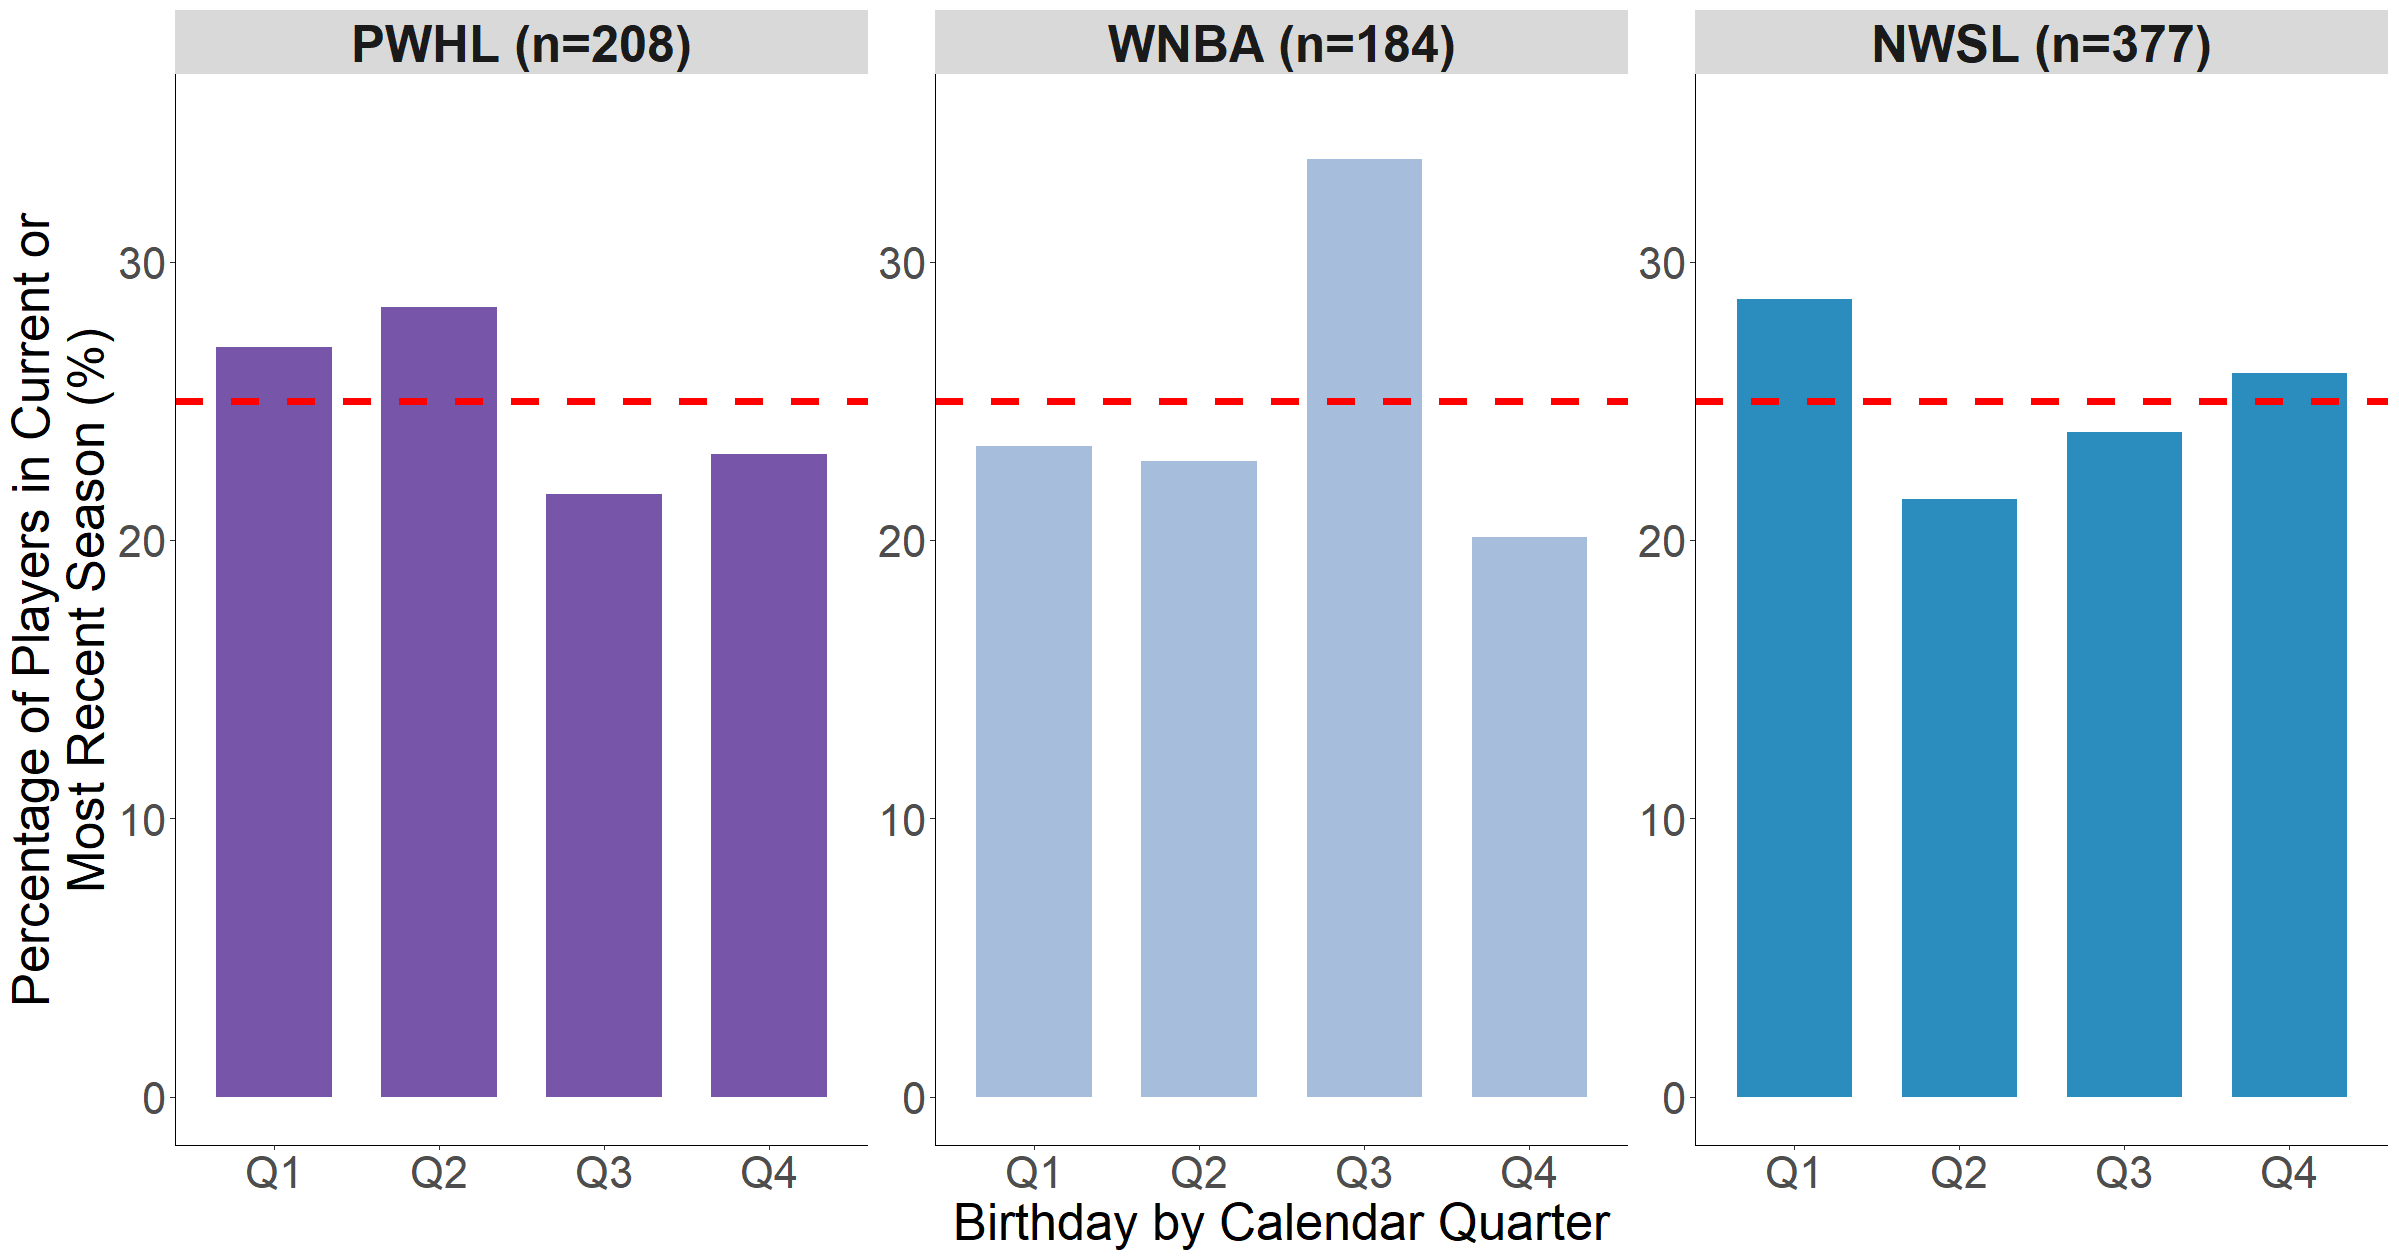
Now let’s broaden the scope and look at data from the most recent season of other professional women’s sports leagues in North America, specifically the Women’s National Basketball Association (WNBA) and National Women’s Soccer League (NWSL), in Figure 4. Although the WNBA has an overrepresentation of players born in Q3, there is minimal evidence of the RAE, with most of the variation appearing to be random, once again.
BONUS: Drilling Down Into Impacts on Performance
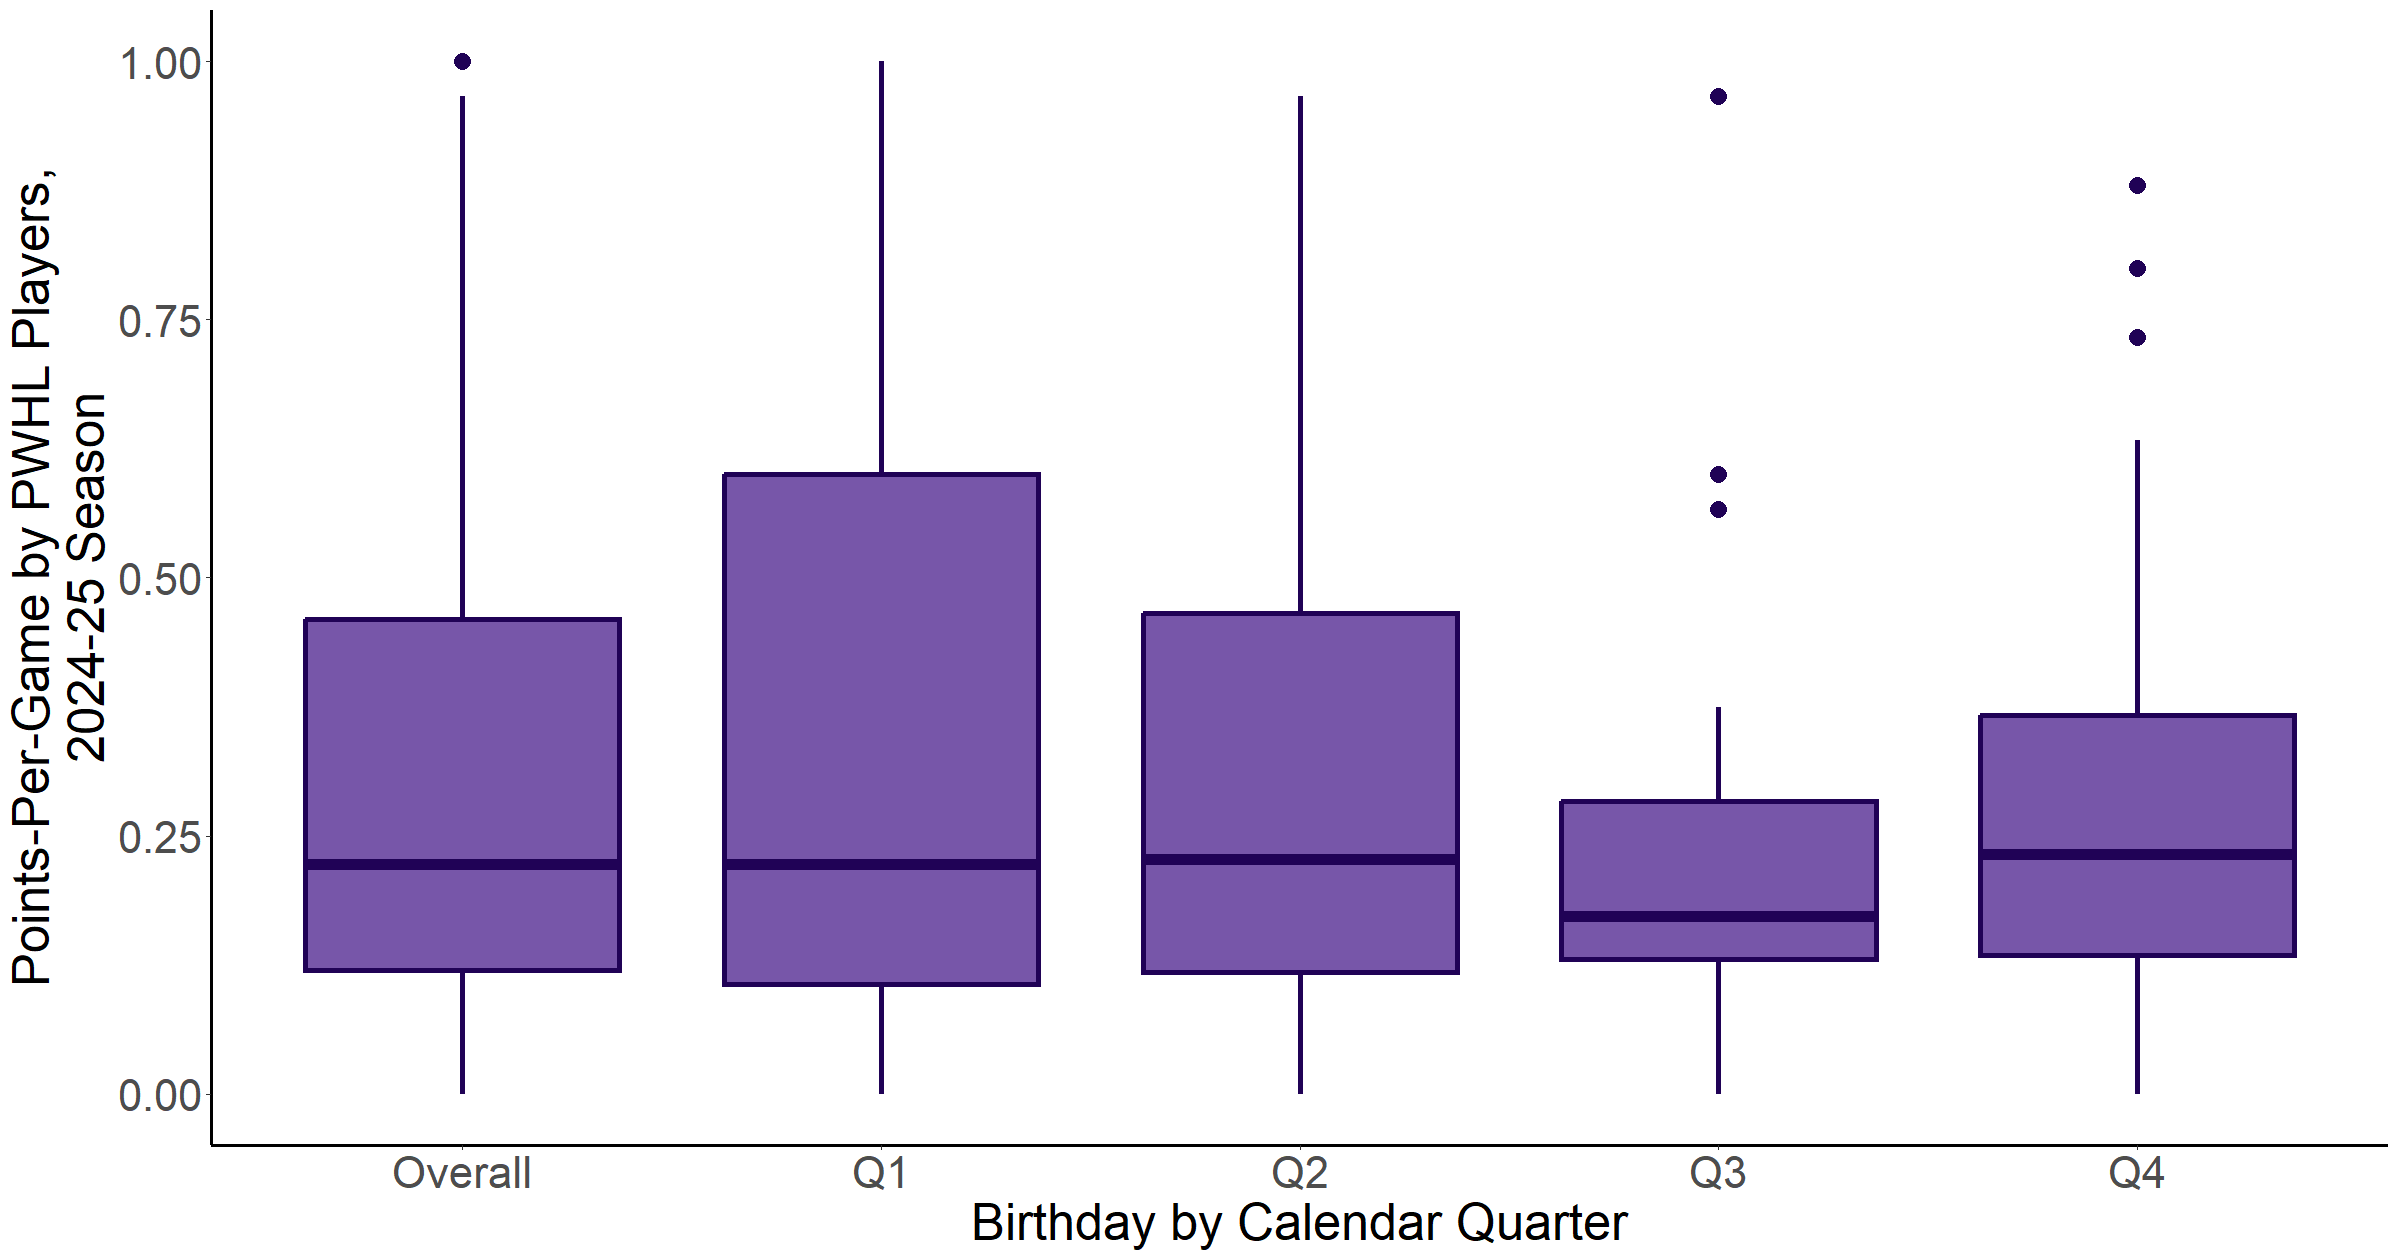
We can take this analysis one step further and see if birth quarter has any appreciable impact on a skater’s point production. This is especially interesting as evidence of the “underdog hypothesis” has been surfacing, suggesting that a reversal of the RAE plays out among professional athletes, as players born later in the year perform higher than their relatively older counterparts at elite levels.5
Visualizing points-per-game (PPG) across the 2024-25 season in Figure 5, there is some difference in the variation in this stat by birth quarter (indicated by taller boxes and longer lines extending from them), but the trend is still quite stable. Using linear regression to model the effect of birth quarter on PPG, we can account for other characteristics that might influence a skater’s performance, such as the team they play on, position they play, and age (i.e., birth year).*** Once again, birth quarter does not impact PPG in a statistically significant way. This is especially not surprising given the fluctuations in PPG pictured in Figure 5 – Q3 players seem to have a slightly lower PPG than Q1 and Q2 players, but performance bounces back among Q4 players.
Summing Up Key Takeaways
This analysis is by no means extensive or conclusive, but it pulls back the curtain a bit and hopefully provokes some thoughts on development and selection of PWHL talent. Although not seemingly a major factor in the current state of the league, the relative age effect might become more relevant as development pathways evolve and competition for roster spots amps up, and it may not affect each position equally. But in the meantime, I hope you find your PWHL birthday buddy (or buddies!) and cheer a little extra for her/them.
Notes
* Chi-squared goodness-of-fit test: χ² = 2.68, df = 3, p=0.44 for 2024-25 and χ² = 2.5, df = 3, p=0.48 for 2025-26.
** Chi-squared test for trend in proportions: χ² = 3.45, df = 1, p=0.06
*** Regression: linear mixed-effects model with crossed random intercepts for team, position, and birth year. The random effect for team was uninformative and contributed unnecessary complexity to the model, so it was removed post hoc.
Research Papers
- Barnsley, R. H., Thompson, A. H., & Barnsley, P. E. (1985). Hockey Success and Birthdate: The Relative Age Effect. The Canadian Association for Health, Physical Education and Recreation Journal, 51(8), 23-28.
- Stenling, A., & Holmström, S. (2014). Evidence of Relative Age Effects in Swedish Women’s Ice Hockey. Talent Development & Excellence, 6(1), 31-40.
- Weir, P. L., Smith, K. L., Paterson, C., & Horton, S. (2010). Canadian Women's Ice Hockey – Evidence of a Relative Age Effect. Talent Development & Excellence, 2(2), 209-217.
- Andrew, M., Finnegan, L., Datson, N., & Dugdale, J. H. (2022). Men Are from Quartile One, Women Are from? Relative Age Effect in European Soccer and the Influence of Age, Success, and Playing Status. Children, 9(11), 1747. https://www.mdpi.com/2227-9067/9/11/1747
- Wang, Y., Csiernik, B., Johnston, K., & Baker, J. (2025). Age effects in NHL draftees: a data-driven review of a multi-dimensional concept. Frontiers in Sports and Active Living, Volume 7 - 2025. https://doi.org/10.3389/fspor.2025.1593409
Data Sources
- PWHL team rosters: https://www.thepwhl.com/en/
- NWSL team sites: https://www.nwslsoccer.com/teams/index
- WNBA: Gilani, S., & Hutchinson, G. (2021). wehoop: Access Women’s Basketball Play by Play Data. In CRAN: Contributed Packages The R Foundation. http://doi.org/10.32614/CRAN.package.wehoop


Comments ()