
Ann-Renée Desbiens's Dominant Season Wins Goalie of the Year & Should Have Won MVP
With Ann-Renee Desbiens having been named the 24/25 PWHL Goalie of the Year, what better time than now to really look into what made her season special?

Last season we were witness to a level of domination that is going to take something truly special to match. I’m of course referring to Natalie Spooner’s 2024 MVP performance, where she scored 20 goals in 24 games (only one on an empty net), when the league average save percentage was 0.921. That’s a pace of 0.83 ġoals per game. If you converted that to an 82-game season, it would equal out to 68 goals! In the 24/25 PWHL regular season, Marie-Philip Poulin led the league in goals with 19 goals in 30 games (0.63 goals per game). With six extra games and the league save percentage having dropped to 0.915 from 0.921, Poulin still couldn’t match Spooner in just goals. And in the inaugural season where goalies were making saves at a higher rate than the 24/25 season, Spooner still holds the record for points per game (1.13) and primary points per game (1.08).
Spooner's performance in the inaugural season was historic right off the bat, as the league arguably recognized when she took home the Billie Jean King MVP, Top Forward, Highest Points Getter, and Highest Goal Scorer awards. This time around there won’t nearly be the same amount of public fanfare for a dominant performance, but I wanted to make sure we acknowledged the season Ann-Renee Desbiens just had.
I’m going to give everyone some leeway here and acknowledge that two notable factors have been holding everyone’s attention and letting Desbiens go under the radar. The first was that the Victoire once again couldn’t score in the playoffs, and despite being the number one team in the league, they were promptly bounced by the Ottawa Charge in four games. Their only win needed four overtimes. The other reason you might have heard of is this barely noticeable occurrence called expansion, where the league is setting a record in sending its fans to therapy. With all that in mind it’s understandable to a certain extent that Desbiens’ season has been forgotten so quickly.
🏆 2025 Goaltender of the Year presented by Rogers: Ann-Renée Desbiens Brick walls don’t move. Neither did Ann-Renée. -- 🏆 Gardienne de l’année 2025, présentée par Rogers : Ann-Renée Desbiens Les murs de briques ne bougent pas. Ann-Renée non plus.
— PWHL (@thepwhl.com) June 25, 2025 at 1:10 PM
[image or embed]
This is why media exists: to help shed light on the stories that are going under the radar. With Ann-Renee Desbiens having been named the 24/25 PWHL Goalie of the Year, what better time than now to really look into what made this season special?
From my point of view, there’s two ways one can show themselves to be a dominant force on the ice. There’s being dominant in comparison to your peers and then there’s your team impact. Natalie Spooner accomplished both these tasks last season, and Ann-Renee Desbiens has done the same by providing a major impact for her team as well as noticeably surpassing her goalie competitors. We’ll start off by looking at how she compares with her fellow goalies this season and last season.

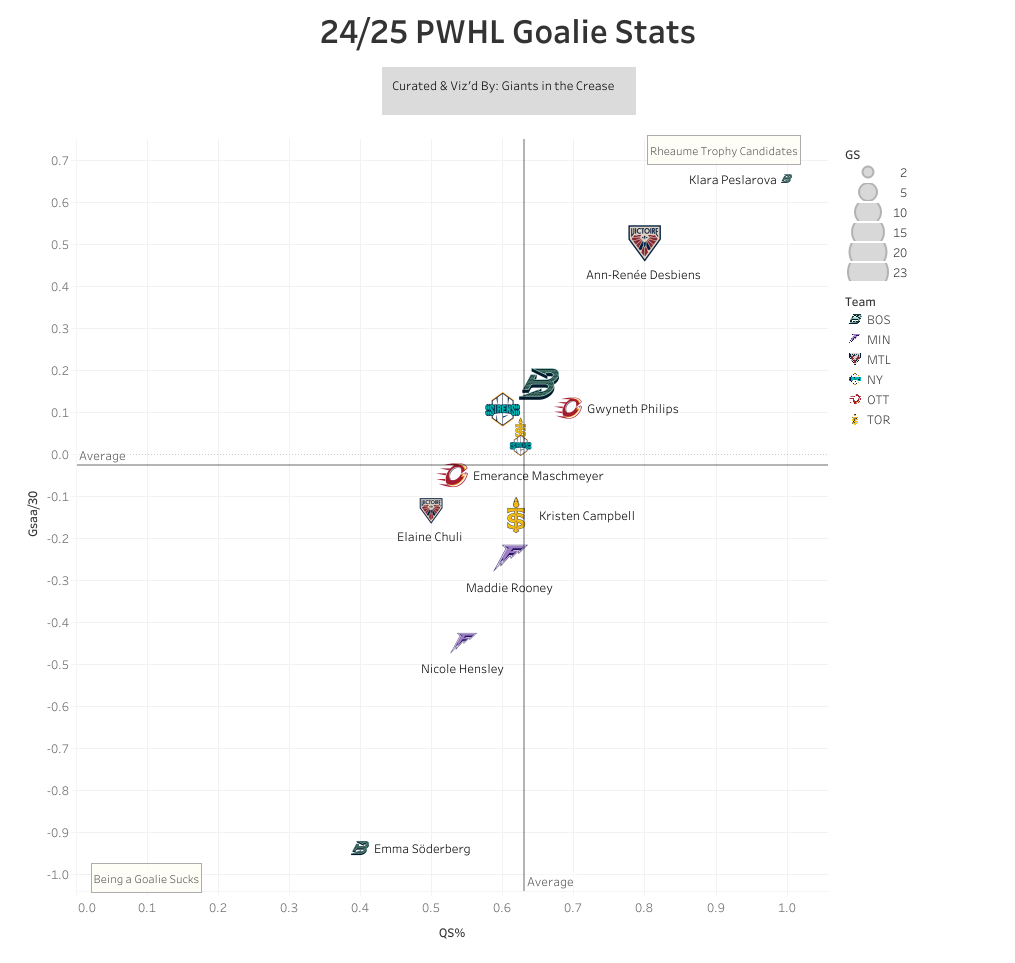
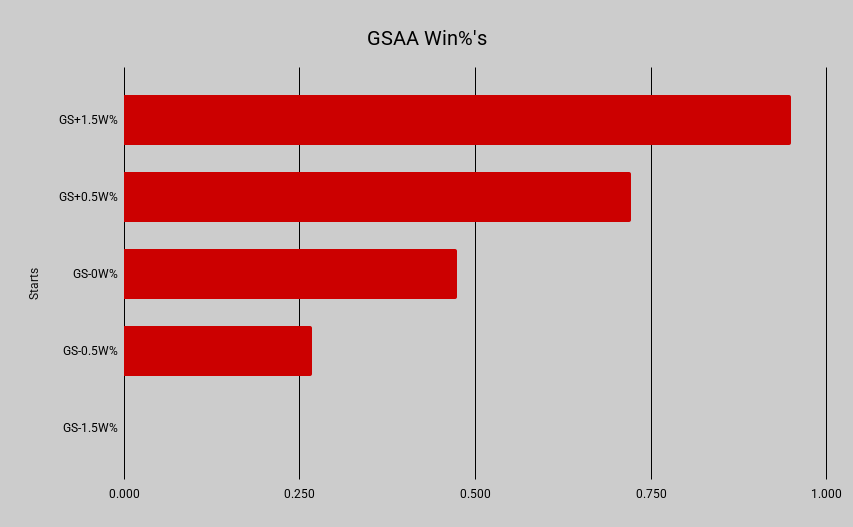
A picture is said to worth a thousand words, so my editors should be sending me a thank you note for including this chart, which will save so much writing and editing. This is my favourite general information type of chart. It's a snapshot of how each goalie did in two of the most accepted general stat categories: Quality Starts % (QS%), which measures how consistent a goalie is, and Goals Saved Above Average/30 Shots Against (GSAA/30), which is another version of save percentage that’s easier to compare over different seasons. If you possess the ability of sight, you’ll notice three key things in this chart. First, there’s not much separating the majority of goalies in the PWHL results wise. Second, Emma Soderberg and Klara Peslarova gave the Boston Fleet wildly different experiences. And third, Ann-Renee Desbiens was a step above everyone else in terms of results.
No other goalie (filtering out the randomness of those goalies who played fewer than five games) had a QS% over 0.700... and there’s Desbiens with a 0.800 QS%. What does that mean? Well, firstly, for those who have no idea what QS% is, it’s a simple formula of quality starts/starts. A quality start is when a goalie starts a game and either posts a save percentage equal or greater than the league average. A goalie can also earn a quality start in a game by allowing two or fewer goals while providing a save percentage equal or greater than the replacement level save percentage. What this ultimately means is that when a goalie in nearly any league posts a quality start their team wins ~70% of the time. For Desbiens, in 80% of her starts, she gave her team a ~70% chance of winning.
Desbiens ended up with 15 wins this season, and in 13 of those wins she posted a quality start. Overall, Desbiens posted 16 quality starts and only three of those quality starts didn’t result in a win. One was a shootout loss, one was a regulation loss, and in the last one, Desbiens wasn’t given the win or loss on because she left the game with an injury and Chuli took over halfway through. Long story short, the Montreal Victoire certainly took advantage of Desbiens's goaltending, as her quality start win% was 81.3%, ~11% higher than the average. Keep this in mind when we go through how Desbiens impacted her team.
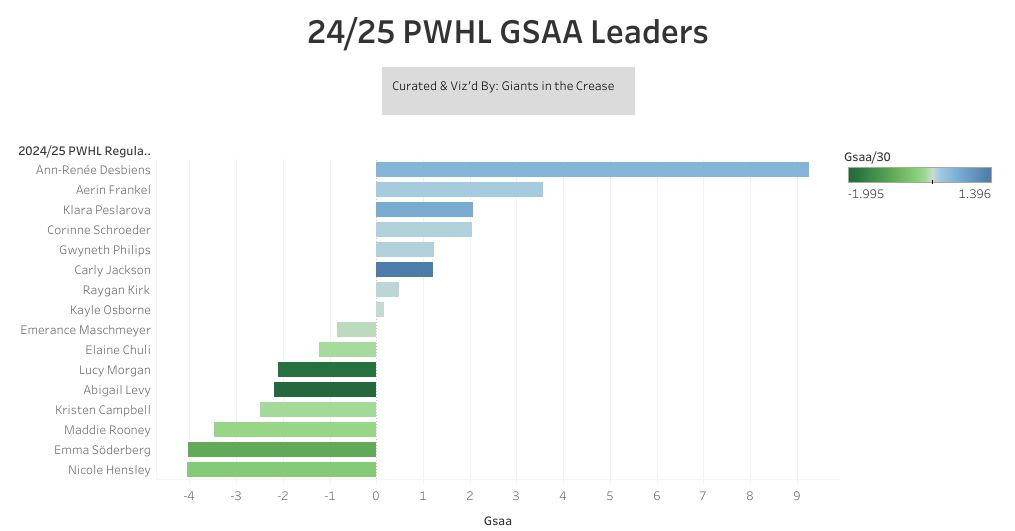
Moving from QS% and into the GSAA related statistics, the domination from Desbiens doesn’t slow down. Desbiens was a few steps above everyone else with her 0.500 GSAA/30 both this season and last season. The closest goalie to Desbiens’ 24/25 GSAA/30 is Schroeder’s 0.256 from the 2024 inaugural season, just a tad over half of the way to Desbiens. No one has been particularly close yet. Going a step further to just looking at cumulative GSAA, Desbiens is far and away the leader. No one was over 4.00 GSAA. Meanwhile, Desbiens is all the way at 9.26 GSAA. We can’t even downplay Desbiens’ GSAA by saying she played a lot more games than the other number one goalies in the league, because she played 21 games. That's tied with Kristen Campbell, behind Aerin Frankel, only one ahead of Corinne Schroeder, two ahead of Maddie Rooney, and three ahead of Emerance Maschmeyer.
The gap grows even larger when you keep diving into the numbers. If there’s anything we’ve learned in the past two seasons of PWHL hockey, it’s how important winning the even-strength battle is. Four out of four teams in 2024 who had a positive even-strength goal differential made the playoffs. In the 24/25 season, the three teams who posted a positive even-strength goal differential made the playoffs with the fourth playoff team being Toronto who had a historically hot power play. And when your goalie is stopping nearly everything at even-strength, it becomes a lot easier to win games.
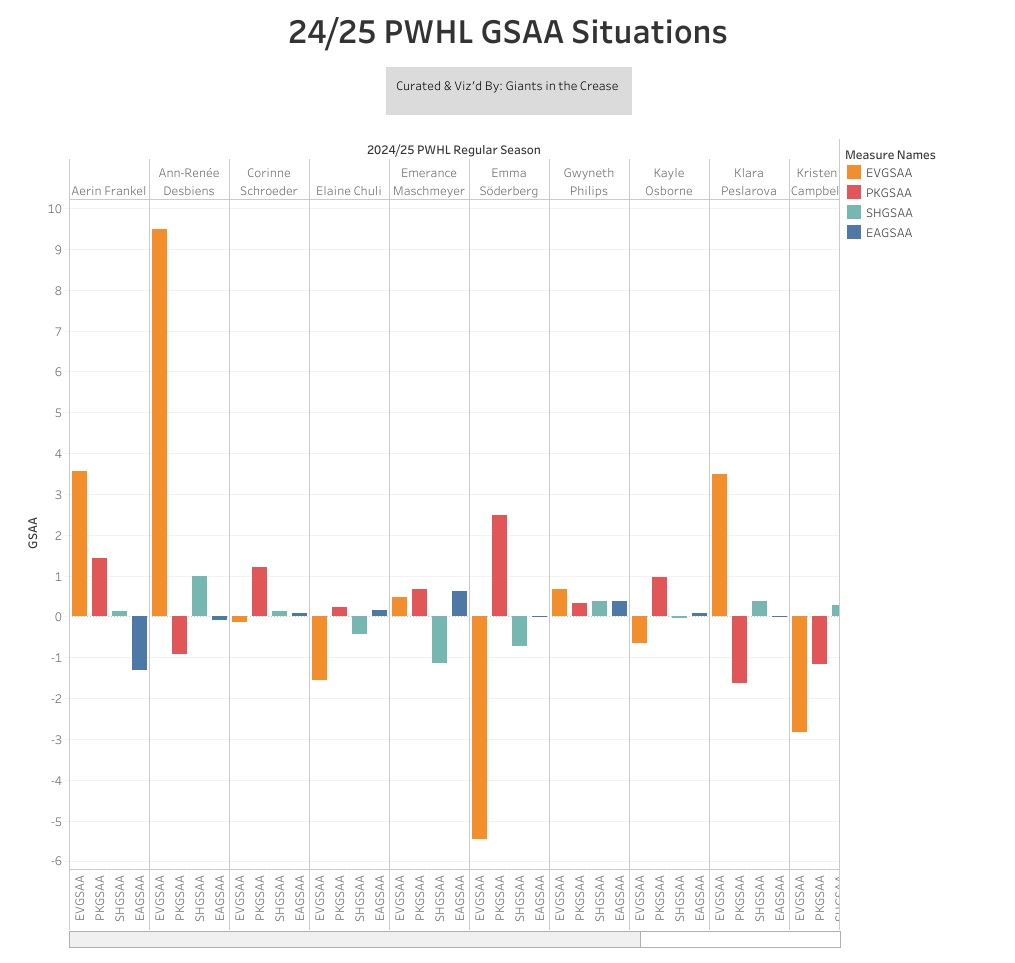
Desbiens was nearly impossible to beat at even-strength. She boasted a league high 0.945 even-strength save percentage; the next closest was Frankel with a 0.930 even-strength save percentage. This means that it would take about 20 shots on goal at even strength to score just one goal on Desbiens. When Montreal is only allowing 22 even-strength shots against per game, you’re only getting a goal on Desbiens. Just like with the all-situations GSAA chart, Desbiens is once again a few steps above everyone in EVGSAA. The impact she had at even strength is hard to dispute numbers wise.
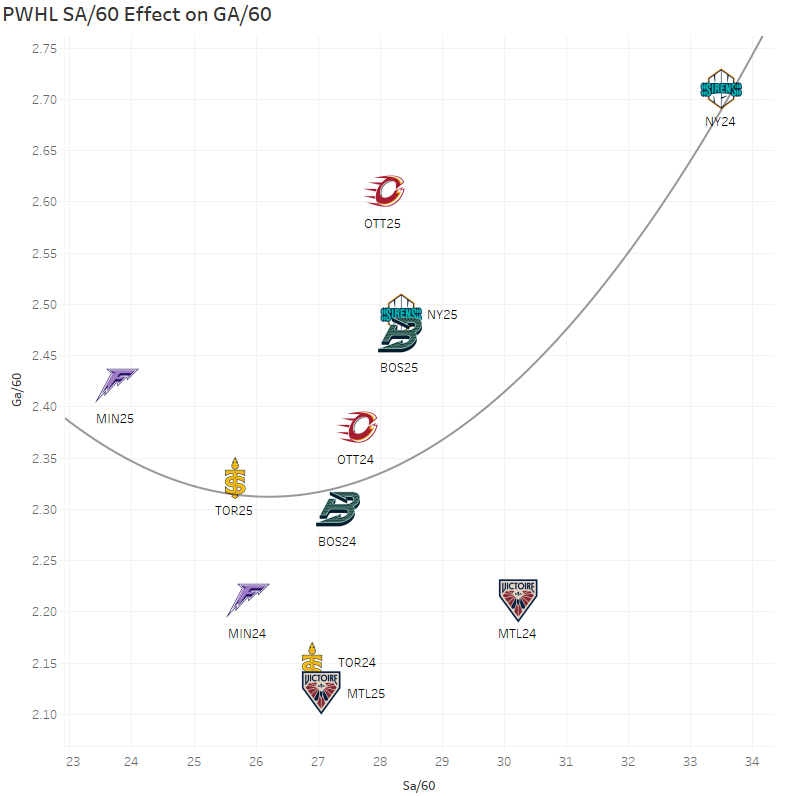
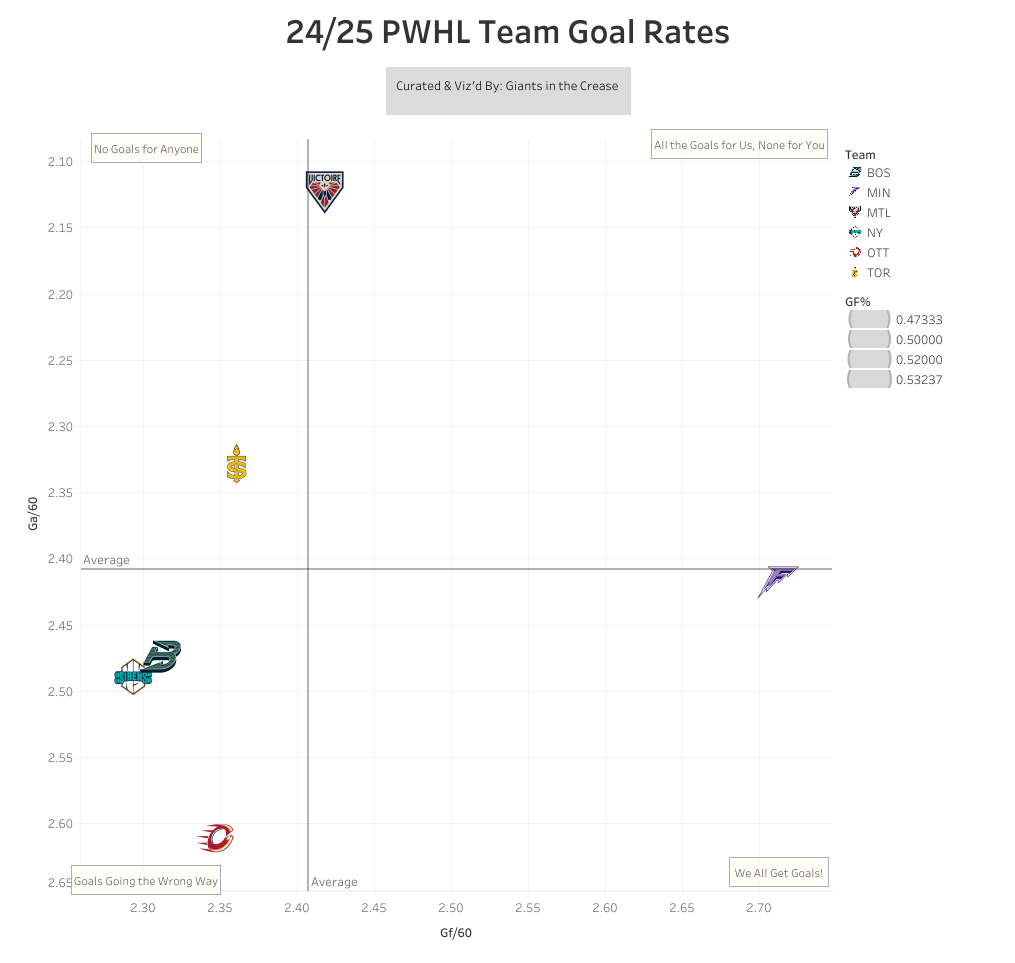
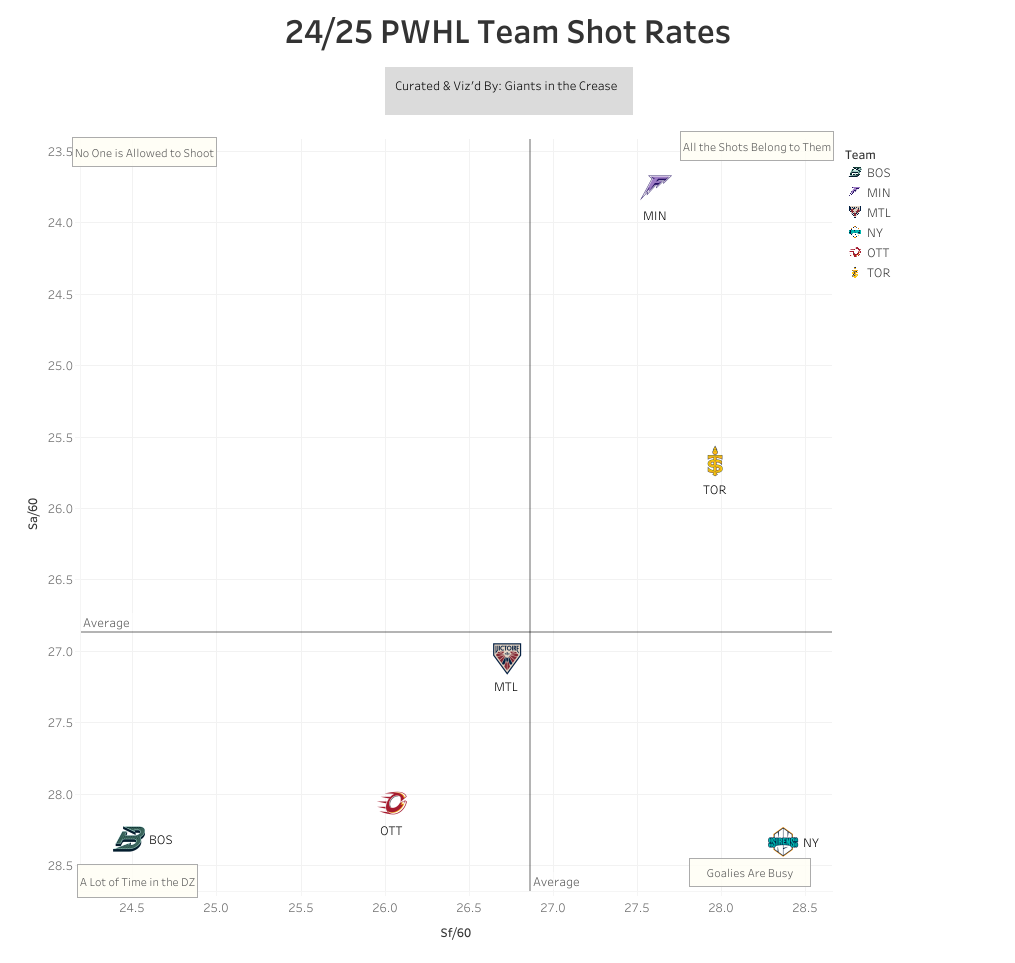
An argument you’ll see against Desbiens is that she played on the best team in the regular season, and goalie stats are affected by the team in front of them. Which raises the question: can we separate defensive results from goalie results? Our first attempt to differentiate defence from goaltending is seeing if there’s any correlation between Goals Against per 60 minutes and Shots Against Per 60. This is all very rudimentary work and not to be taken as absolute, merely a piece in the puzzle. Without xGA numbers, we don’t have much to work with. However, this is a fine start for what we have. Looking at the GA/60 vs SA/60 charts for the two seasons we’ve gotten in the PWHL, the more a team allows shots on their goalies, the more goals are going to go in. The fact that Desbiens allowed so few goals suggests two possibilities: either the defence in front of her was great, which explains the large gap, or she was great and made her team's defensive results look better. There's no way to definitively prove that right now, so we push on, as not all shots are created equal.
Another way of trying to differentiate the results to better understand who deserves more credit for Montreal’s numbers is comparing shot charts courtesy of PWHL Insights. Now, relying on shot location to tell us the difficulty of a goalie’s workload is flawed. Pre-shot puck movement would provide a more accurate picture. However, we don’t have that unfortunately, so we’re going to have to rely on just shot location. With that in mind, is there anything we can learn here that will help better answer our questions? Unfortunately there’s not much to glean there and what you can glean, I think, helps Desbiens's case. Why is that? Well, the prevailing theory is that Frankel faced tougher shots because the Fleet were a worse defensive team.
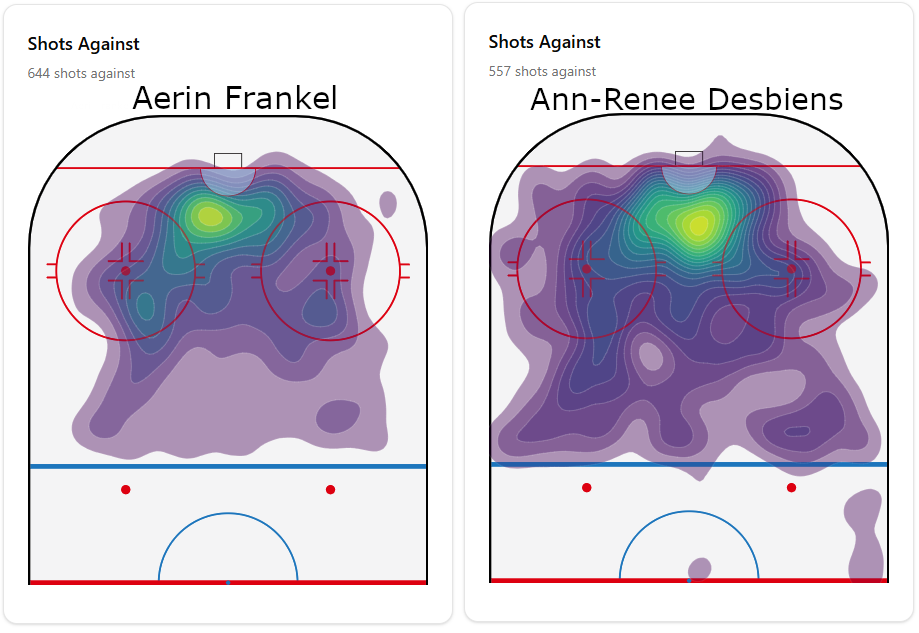
I don’t think that’s necessarily wrong, but I’ll add that I don’t think the gap is that wide. If you look at Desbiens’s and Frankel’s shot charts for the season there’s some information that stands out. Desbiens saw a lot of shots from just everywhere but also saw a lot in close. Look at how bright green that spot is right in front of the net. Looking at Frankel’s shot chart, there’s no bright green spot like Desbiens has, but Frankel isn’t seeing the same volume of shots from just anywhere. By the looks of the chart, teams liked shooting from the right side of the ice on Frankel.
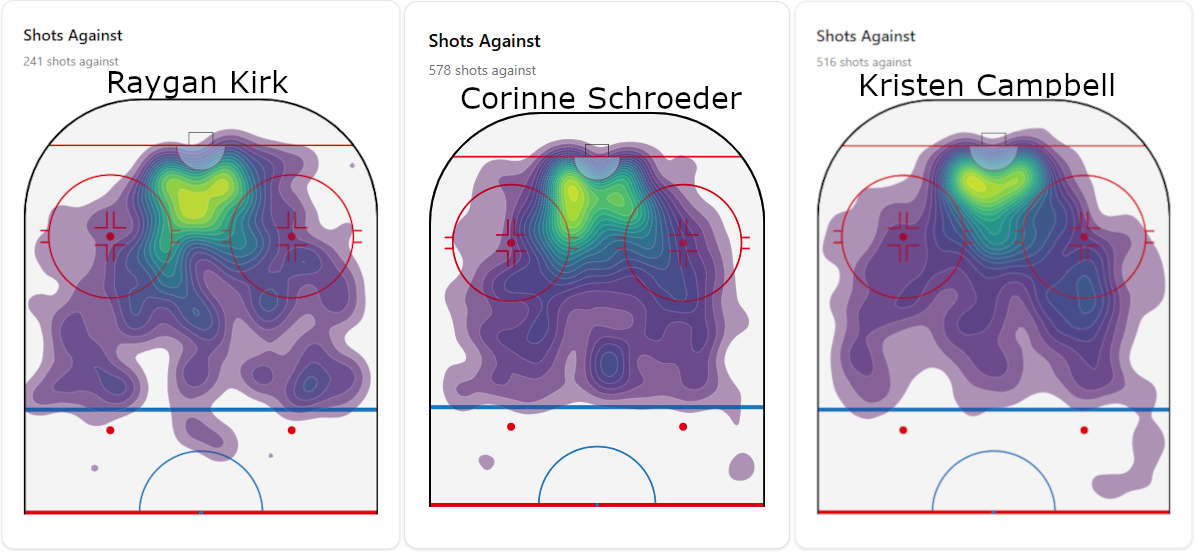
What does this all mean? Personally, I believe it difficult to glean information from just two sources, so I did some more digging on PWHL Insights, where I found the shot charts of Kristen Campbell, Raygan Kirk, and Corinne Schroeder. I think if we want to define what bad defence looks like on a shot chart, this might be the answer. Just the whole front of the crease for all of them being bright green can’t be good. Having one spot where teams are finding a hole in the defense in front of the net is one thing like we’re seeing with Desbiens and Frankel. The whole front of the net being open for business is not great. One might even say that’s bad.
I ask this question a lot and I’ll ask it again: what does this all mean? To me, it means that while Frankel certainly wasn’t facing the easiest workload in the league, she’s closer to Desbiens than arguably the toughest defensive situations in the league, which appear to be Toronto/New York. I believe it’s hard to make a case that the defensive situation in front of Desbiens/Frankel is the reason for the gap in their results. Montreal was the better team this year offensively and defensively. It’s just hard to find an argument as to the gap being so wide defensively is what’s causing Desbiens’ results to be far and away better than everyone else’s.
[Author's note: looking at this really makes you think Schroeder should have been one of the three finalists for Goalie of the Year.]
There’s still one more road I want to travel down before essentially debunking the idea that Desbiens’ dominant season is the result of great defensive play, and that is comparing the results of the number one goalie to the results of the number two goalie. Usually, this would be an extremely flawed comparison because the talent level between the starting goalie and second goalie would factor in a lot to the results. The 24/25 PWHL season might be the first and last time we see goalie tandems across the league see such a small gap in talent. Elaine Chuli, the former second goalie of Montreal, will be given the opportunity to be the starter in Toronto.
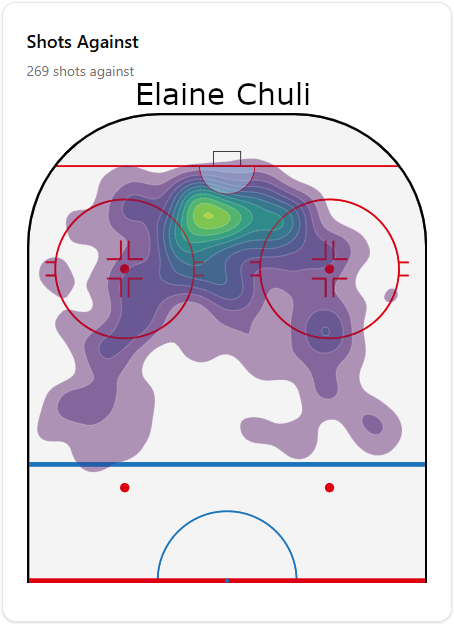
Despite the closeness in talent, the results would struggle to be further apart than they already are. Both goalies had a similar SA/60—Chuli had a 27.02 SA/60 and Desbiens had a 27.16 SA/60—but that’s the last thing they’re close in. Desbiens finished the season with a 0.932 save percentage. Meanwhile, Chuli was below the league average save percentage of 0.915, with a 0.910. Once again, if we go to the shot charts, Chuli’s doesn’t look that different from Desbiens's. We could even say they faced two completely different types of defensive environments.
The starting goalie outplaying the second goalie isn’t exactly uncommon, though, and if we take this line of thinking to Frankel, it starts getting complicated. For one, Emma Söderberg started out as the second goalie behind Frankel but was replaced by Klára Peslarová after the WHC break. Söderberg only played 80 more minutes than Peslarová, and neither goalie played over 300 minutes. Meanwhile Chuli played just a hair under 600 minutes, helping to keep the randomness of her numbers more subdued compared to Söderberg/Peslarová, whose numbers are more prone to randomness sneaking in.
All of this makes it more difficult to figure out what the true standard of play for the Boston defence and baseline expectations are for a goalie behind that defence. You have Söderberg with a 0.884 save percentage, and meanwhile, there’s Peslarová with a 0.937 save percentage. So is Boston such a good defensive team that a goalie can put up a 0.937 in 200 minutes of play, or is Boston really bad at defence, which is why you have a goalie with a 0.884 save percentage in ~280 minutes of play? If you combine their numbers, you have a 0.906 save percentage in ~480 minutes of play, which is a lot closer to Chuli’s 0.910 savep ercentage. Obviously this isn’t a perfect method, as there’s still the fact that both goalies behind Frankel had polar opposite results. So, at best we see that the second goalie in Boston behind Frankel has slightly less worse results than the second goalie in Montreal, and at worst, the Boston defence wasn’t so bad that no one sans Frankel could survive there.
With all of this in mind, I personally believe we can come to the conclusion that team strength is not what separated Desbiens from her fellow goalies. Desbiens truly had a season that was above and beyond what her fellow goalies could match. The gap is just too large to claim that Montreal played just so well in front of her that it explains why Desbiens’s stats are so much better than everyone else’s. Unless we get Clear Sight Analytics in here to sort all of this out, I don’t know how else you explain the gap apart except for anecdotal evidence.
Previously I mentioned what makes for a historic season is how you compare to your fellows and your team impact. We went over in great detail how to compare Desbiens to the rest of the PWHL goalies. Now it’s time to lay out Desbiens's MVP case and how she was snubbed, as the kids say.
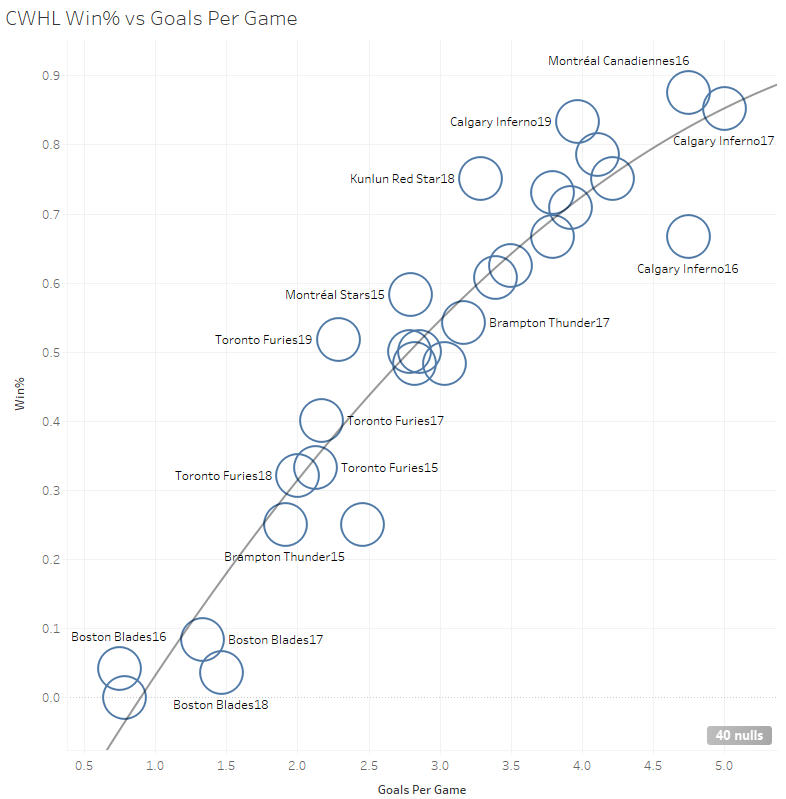
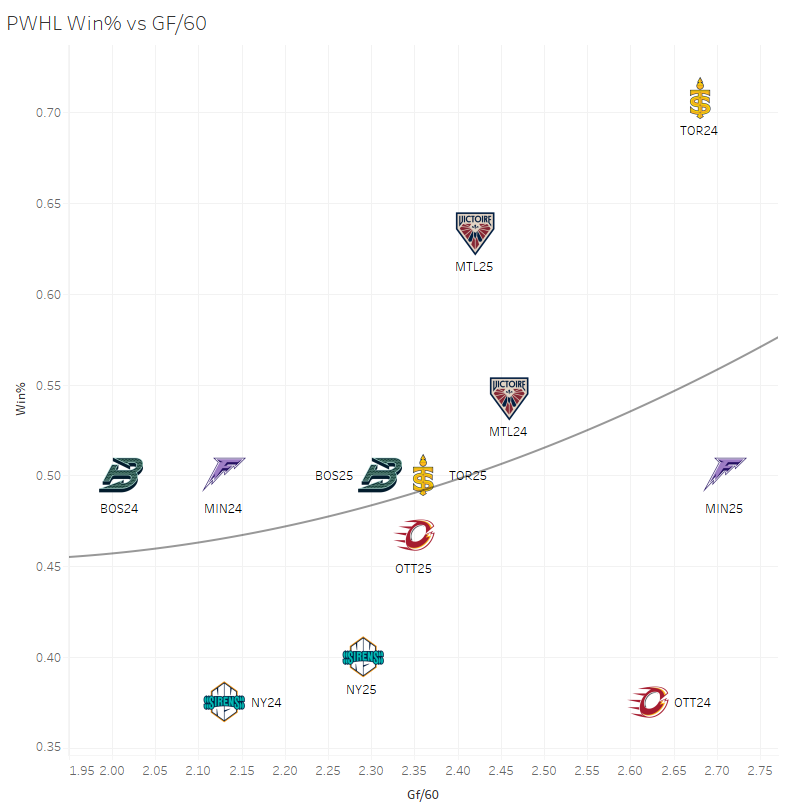
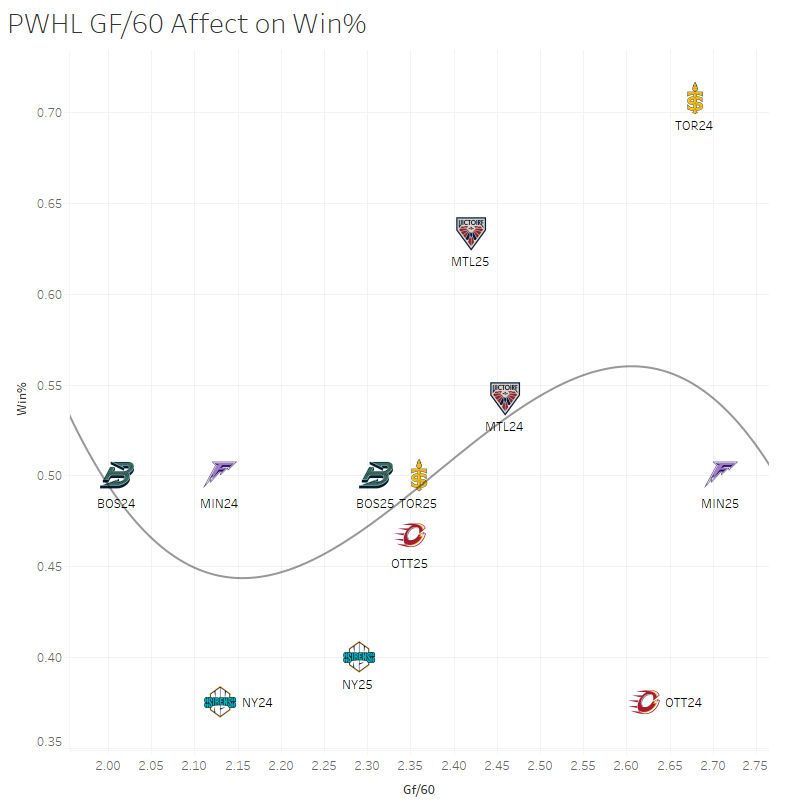
If you were to look at the various leagues that have, or continue to exist, in women’s hockey you’ll notice a simple trend. The more goals you score per game, the more you’re going to win. It is almost silly just how sharply that trend line goes up on these goals per game and win percentage charts. This makes sense though when you consider that the CWHL, PHF, and SDHL all struggled, or continue to struggle, with parity. There was always at least two tiers, the haves and have-nots. The haves, like Les Canadiennes De Montreal or Minnesota Whitecaps or Lulea HC, got the majority of the talent and scored almost at will, not really needing goaltending help. One of those teams could have a pumpkin in net and still not lose more than a few games.
We have to keep in mind that the PWHL is essentially a brand new league still, and the sample sizes aren’t the same as the previously mentioned leagues. Two seasons is better than nothing though, and I believe we’re seeing a difference between all those leagues with the PWHL. The PWHL’s parity has given goaltenders the opportunity to make more of an impact than in any other league.
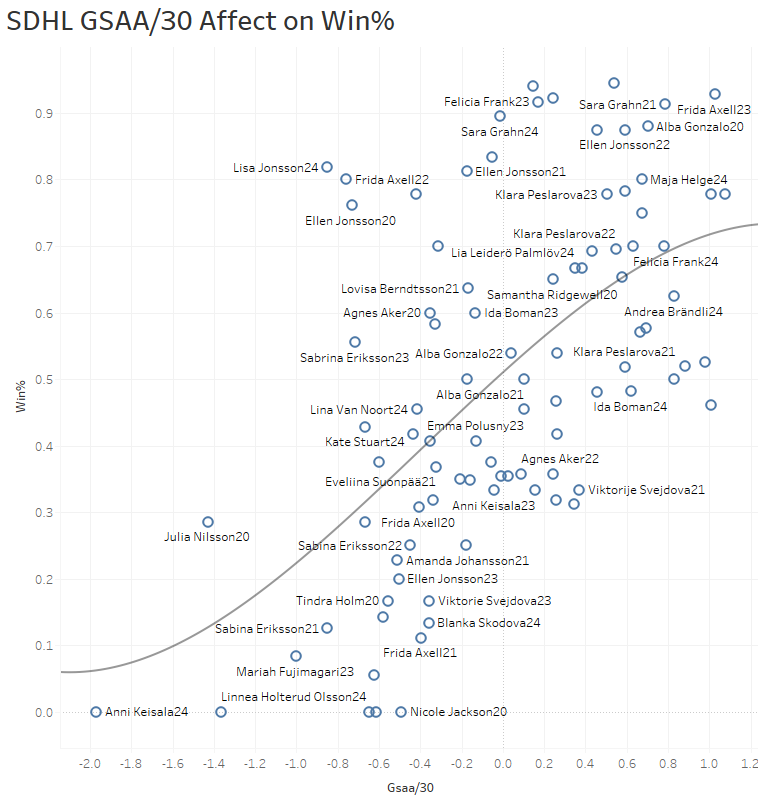
What we’re looking at here is the relationship between GSAA/30 and a goalie's win percentage. We’re using GSAA/30 because I’ve found it’s the best way to do era adjusted save percentages without adding in extra calculations. Looking at the PHF and SDHL, which we have so much goalie stat data for, we see that win percentage rises with the GSAA/30. You’ll also notice, though, that eventually once you reach the highest peaks of GSAA/30, you start hitting diminishing returns in terms of win percentage. There are two reasons for that. If your GSAA/30 is that high, you’re either a goalie who is seeing so many shots against that your stats are starting to get a bit inflated, or you’re on a nearly unbeatable team where you’re not being challenged much so the scoring has a larger effect on win% than you do.
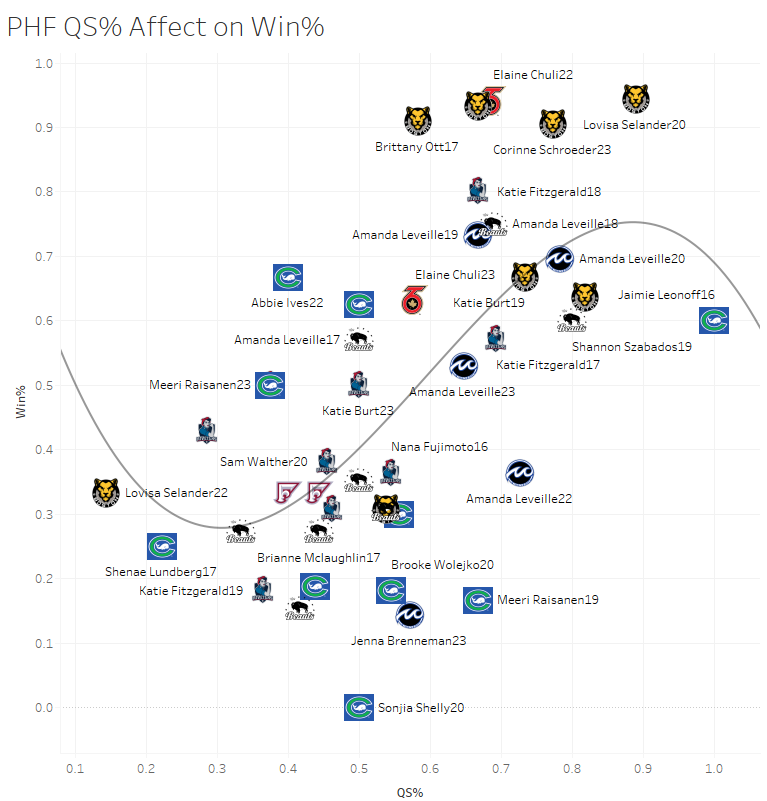
You’ll notice a similar trend with QS% and its relationship with win percentage. Eventually it reaches its peak and becomes redundant, because if your team isn’t scoring the necessary amount of goals to win games that you’re giving them quality starts in. It also just becomes nearly impossible to win 80% of games because that’s just how hockey is. No matter how good you are, unless you’re Lulea out of the SDHL, you’re not consistently scoring four goals a game to ensure wins. Eventually you are going to run into teams where you’ll still post a quality start, but you allow three goals and the opposing goalie allowed two.
It's possible in the future we start seeing the same statistical occurrence happen in the PWHL where a goalie's results reach diminishing returns and a team just can’t keep the same scoring consistency to match their goalies’ puck stopping ability. What’s interesting is that so far in the PWHL, teams are taking advantage of their goaltending to the point where there is no diminishing returns. The parity in the league requires a goalie to be more than average, and if that goalie is more than average, your chances at winning a game have skyrocketed.
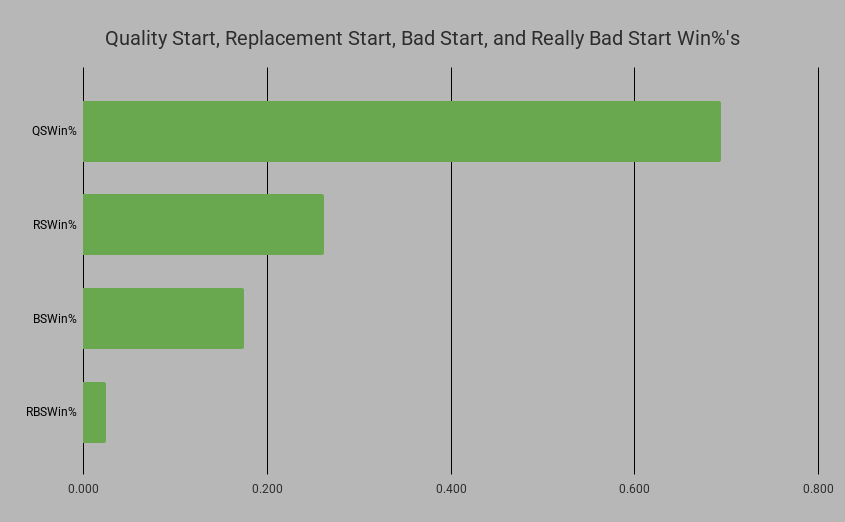
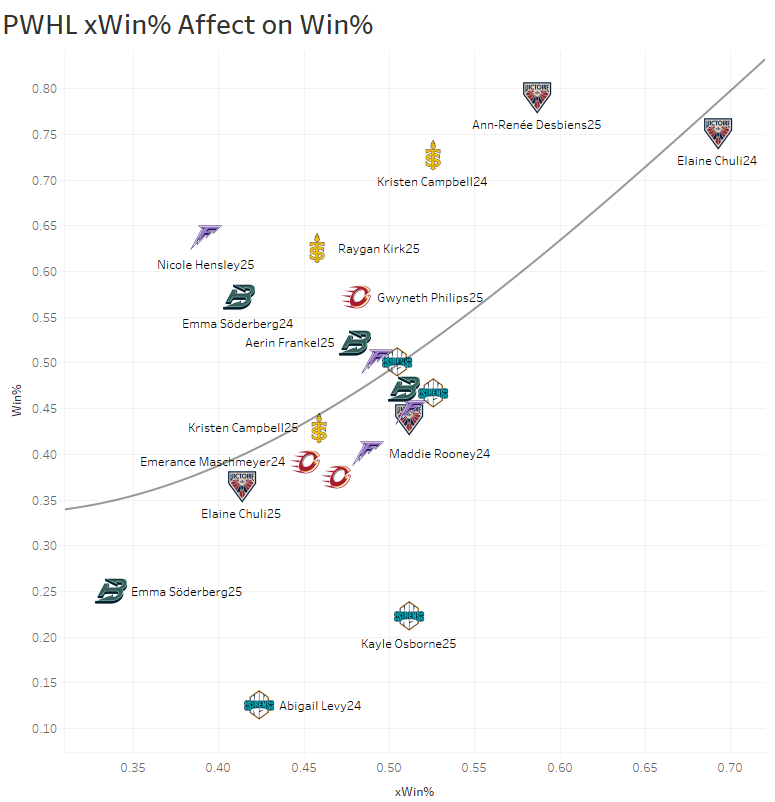
There’s two ways I measure a goalie's impact per game and over the course of the season. I try to stay away from cumulative stats such as GSAA and go with either QS% or something of my own creation called xWin%. As mentioned above, QS% measures how many times a goalie posts a save percentage equal or above league average. The win percentage of a quality start is currently at 67% for PWHL goalies. That’s a decent chance at winning but still leaves over a 30% chance at losing and doesn’t account for goalies who have an exceptional game.
That’s why I came up with a stat of my own, xWins or xWin%. We don’t have access to even half decent expected goals numbers, so the next best thing in my opinion was taking GSAA and measuring it game by game. It’s not perfect by any means. However, it helps to provide a general idea as to the impact a goalie can give their team. If a PWHL goalie has a GSAA in a game that’s near the 0.000 mark, and essentially within the margin of error, they only give their team a 47.3% chance of winning the game. The game is a coin flip when a PWHL team receives average goaltending. When it hits the ~1.000 GSAA mark, a goalie is giving their team a +70% chance at winning. After that a goalie nearly never loses as seen in this chart.
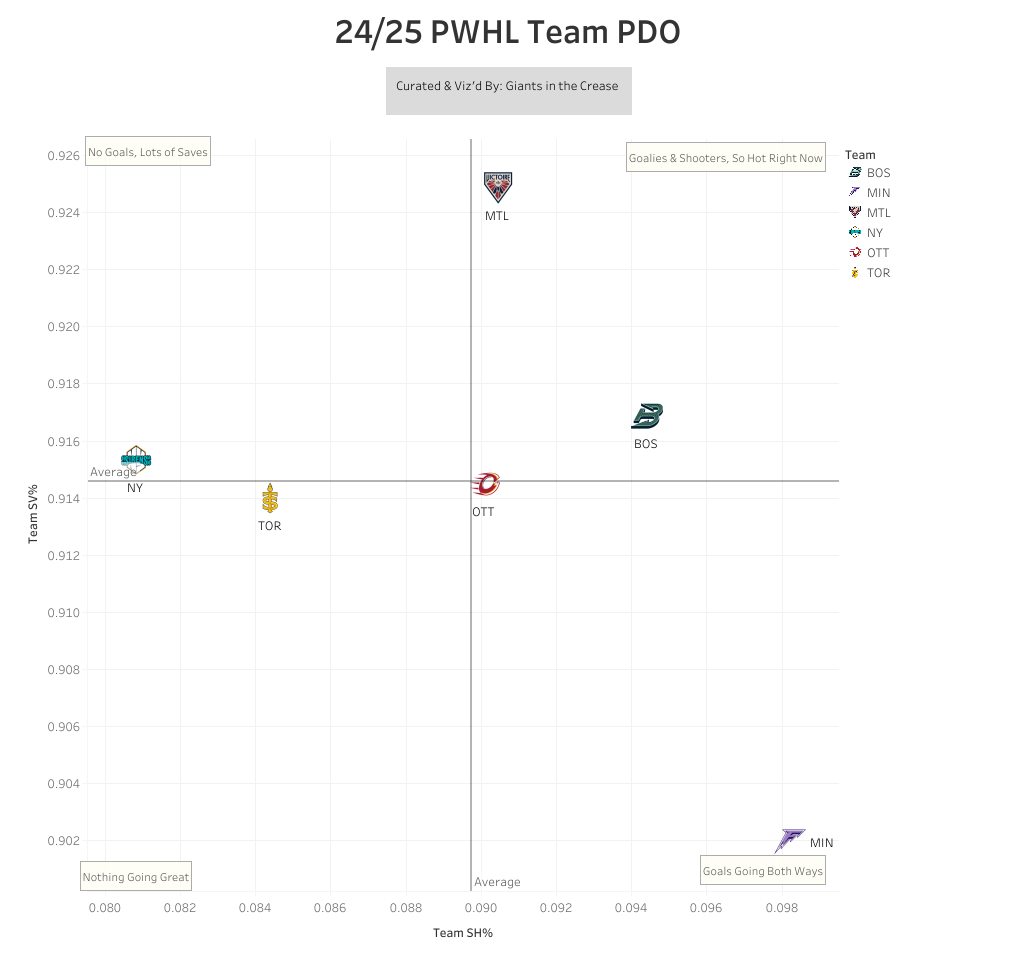
This is an article about Ann-Renee Desbiens, so what does this all of this have to do with her? It’s to show how much a goalie can impact a team and, more specifically, how Desbiens impacted her team. Montreal finished first in the regular season, and arguably, Desbiens played the largest role in getting them there. Now the argument immediately against this is that the team in front of Desbiens did the heavy lifting, and look, Montreal was good this year. They didn’t PDO their way to a first place finish. Yes they finished first in PDO but they had the highest team SV% (0.925) while only having the third highest team SH% (9.05).
In fact, while the goals per game in the league rose from 4.82 to 5.00, Montreal’s goal scoring actually dropped. Obviously not by a lot—2.46 to 2.42 GF/60—but while league scoring went up, the Victoire saw fewer goals per game from their team. I think we can conclusively say that Montreal was not an offensive juggernaut that rolled teams over.
What was the biggest change for Montreal? Last season Desbiens had a 0.048 GSAA/30 and 0.512 xWin%. This season Desbiens posted a 0.500 GSAA/30 and 0.587 xWin%. Nine out of 20 of her starts featured a single game GSAA of 0.500 or higher, with another nine starts being those coin flip games mentioned earlier. Desbiens only had two games where her team had a fewer than 30% chance at winning said games. Every time she stepped on the ice, apart from two games, her team had about an equal chance or more at winning that game.
In comparison, Frankel, Schroeder, and Philips all had more games where they gave their team a lower than 30% chance at winning than Desbiens did. Frankel and Schroeder each had seven games started below average, while Philips, in 13 starts, still had four starts before average. Every goalie is out there having multiple games where they need their team to cover up for these less-than-ideal games. And there’s Desbiens ensuring that her team, in 18 of 20 starts, has at least an ~50% chance of winning the game.
Let’s look at this another way to drive home the point. The league average is to have 32.7% of your starts be below average or worse, leading to a 26.7% win percentage, at best, in those games. Desbiens only had 10% of her starts be below average. When your team is the second best offensive team in the league, second in GF/60 and tied for second in EVGF/GP, your goalie giving you at least a 50% chance at winning games in 90% of games is going to lead to a lot of wins. When that same goalie is giving your team at least a 72.1% chance at winning a game in 45% of their starts, you’re going to win so many games unless you’re incapable of scoring. Montreal gets rightfully criticized for their scoring drying up to end the season and in the playoffs especially. They were capable of scoring, though, for most of the regular season, leading them to be second in GF/60 and tied for second in EVGF/GP.
Montreal being so high in the goals for stat areas, though, isn’t much to brag about. Minnesota finished first with 83 goals, Montreal finished second with 74 goals, and New York finished last in scoring with 70 goals. You’ll notice that there’s a far larger gap between the best and second best scoring team than there is between the second and last place team. With the goal scoring being such a minimal advantage for Montreal, the only way for Montreal to finish first in the league is turning scoring from a minimal advantage into an actual advantage.
The only way you do that is through good defence and good goaltending. Montreal got the former, as the stats and shot charts suggest. Montreal finished third in shot suppression, only allowing 27.05 SA/60, though they were a lot closer to the worst shot suppression teams in New York/Boston (~28.33) than they were the best shot suppression team in Minnesota (23.76). This is where Desbiens came in being the biggest difference maker for Montreal. Montreal wasn’t going to finish first because they scored noticeably more than their opponents or because they were suppressing opposing defences. They finished first because they were a good team with a great goalie. Montreal lapped the competition in team save percentage (0.925) because Desbiens is over there with a 0.932 save percentage well over the league average of a 0.915 save percentage.
Desbiens was the difference maker this season for Montreal. The Victoire offence and defence was good enough to put them into playoff contention. You need that level of offence and defence in order to be in a spot to push for first place. The Fleet and Sirens got good goaltending but the offence, especially the offence, and defence weren’t there so they missed the playoffs. Montreal got next world goaltending from Desbiens and that’s why they finished first. Montreal felt so dominant, even with MPP going the first seven games with only one goal and then MPP scoring the only goals in the last part of the season. And that's because Desbiens made it look like the opposing team never stood a chance.
Comments ()